

If you’ve been following our content for a while, you’ll know that one of our key services as an agency is to help financial services companies acquire leads and customers with content.
We create expert-based Bottom of the Funnel content that ranks on Google and attracts prospects who are looking for a solution but might not be aware that your product exist. We then use a mix of HubSpot and Google Analytics to track how many leads our content brings in.
But the thing is, bringing in 10 leads per month doesn’t mean anything if all the leads are low quality.
This is especially true for the high ticket B2B companies that we work with: we might only need a handful of high quality leads to return a positive ROI, but that only works if they are actually high quality – in other words, they are qualified, have a high chance of converting and are high value.
With tools like Google Analytics, you can see the number of form submissions and events your content brings in. But a more important question is: is it bringing in the right type of customers? For content marketing to be truly effective, it needs to be bringing in the right type of customers.
This article is for those content marketers or marketing managers that not only want to track the number of leads that come in, but also the quality of those leads.
At Mint Studios, we do this by connecting our client’s financial services website to HubSpot which allows us to see contact information (and evaluate leads on a case by case basis) as well as the size of deals input by the sales team.
For this article, we’ll be focusing on how to track the quality of the leads via HubSpot only. We haven’t found a better tool than HubSpot yet, so we’ll be focusing only on them in this piece:
- Why HubSpot works well when evaluating lead quality
- HubSpot tracking: the top four reports to help track results
Note: want to get updated every time we publish a new article? Join our newsletter and we’ll send through our latest content every 2 weeks!
Why HubSpot works well when evaluating lead quality
We believe HubSpot is a content marketer’s best friend. It’s a tool that allows you to learn more about the people who are visiting your website, understand what converts them into leads and also helps you prove that your content contributes to the business.
There are two key reasons every content marketer should be implementing HubSpot:
1. It allows you to prove the business results of your work
In 2024, more companies are focusing on revenue and have tighter budgets. Marketers are being tasked with focusing on lead generation and revenue focused activities, and then proving the business results of their efforts. This also includes content marketers.
With HubSpot, you can attribute the leads and new contacts to specific blog posts that you’ve witten. Not only that, but you can also track which contacts were influenced by your content, which is also huge, as we’ll get into later in this post.
Essentially, HubSpot allows you to prove to your boss and leadership team that content is instrumental to acquiring new customers – and therefore to revenue. With HubSpot, we were able to prove to our client that our content was helping them generate $500k+ in deals.
This client’s HubSpot was integrated with Salesforce. Whenever the sales team talked to a new lead, they would input the expected revenue from that potential customer. We’ll get into the specific reports later on in the article, but having this report is huge for the marketing team (and for us).
You can read how we helped this client get these six figure customers with content in this case study: Case Study: How We Helped Zai Gain Multiple SQLs Per Month with Content
As an agency, we can say that our content has helped bring in over six figures worth of deals. That’s incredibly powerful to say as a content marketer, because it means.
- You’ll be more respected in your job as it is seen as essential.
- You’re more likely to keep your marketing budget/job.
- You get more credit for your work (so the credit doesn’t all go to the sales team).
2. It helps direct your marketing strategy
As more businesses focus more on revenue and adding to the bottom line, your marketing strategy will evolve too. This likely means you’ll be moving away from branding activities, and more towards marketing that helps with lead generation and customer acquisition.
By having HubSpot correctly set up, you can see with a couple of reports which are the activities that in the past have worked well for lead generation.
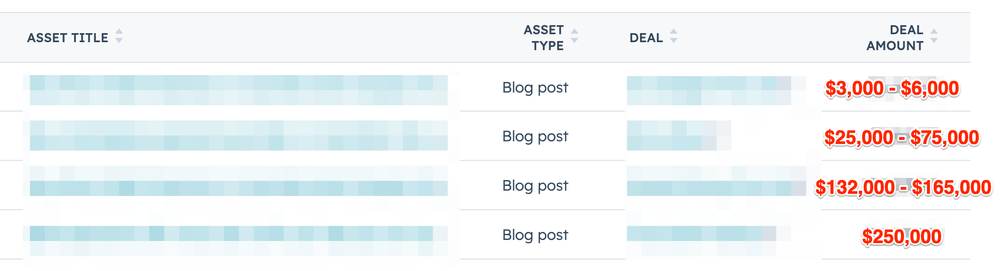
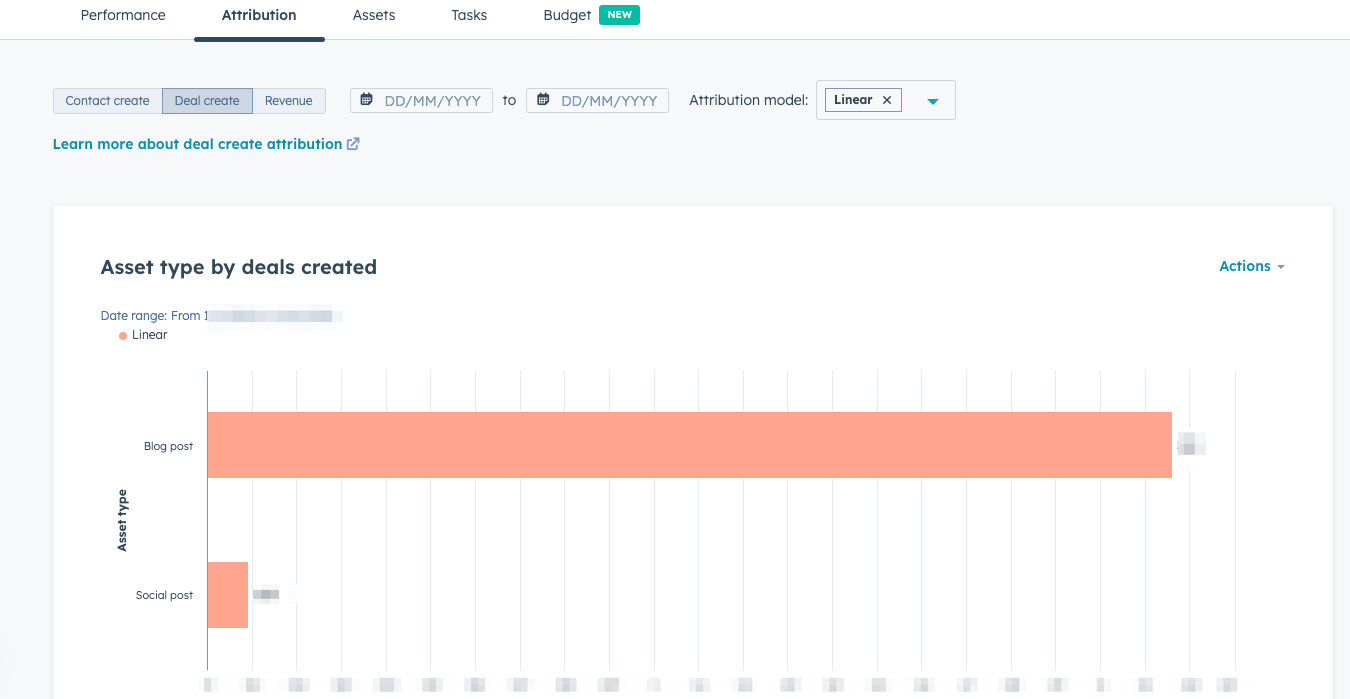
As per the screenshot above, we now know that certain blog topics have brought in customers worth $100k+. Does that mean it’s worth focusing more on these topics? Maybe we could create more content that covers the topic in more detail, or promote this piece of content on LinkedIn.
Knowing the content that has brought in the highest value customers is the type of information that is instrumental to creating a marketing strategy that focuses on revenue generation. It helps us when creating a content strategy, and we couldn’t imagine doing effective content without this level of information.
How do I find out all this information on HubSpot? Which reports are worth setting up?
We’ll now go through six of the top key reports to get this information on HubSpot. We’re going to assume you have a certain level of knowledge about HubSpot, if you don’t, we recommend checking out their free courses: HubSpot Get Started
HubSpot tracking: the top six reports to help track results
Before we start talking about reports, it’s important to clarify that there are two ways to have HubSpot set up:
- HubSpot is your CMS and CRM, and therefore you upload your articles directly onto HubSpot for the blog.
- HubSpot is only your CRM, where it is linked to your website, but you upload your blog posts somewhere else like Webflow, Squarespace or Wordpress.
If HubSpot is also both your CMS and CRM, it’s a lot easier to set up certain reports and track results from your content. However, the most important reports can still be set up even if HubSpot is just your CRM.
1. Report: First and last click contact create
Hubpost can be your CRM only
You can set this report up if HubSpot is only your CRM and not your CMS (which is great for those who use Wordpress, Prism, Squarespace, etc).
This report is the first one we set up when we start working with a client.
As a content marketer, first click attribution is your best friend: first click tracks the people who discovered your website via your content, whether it’s via an ad or research on Google. If it weren’t for your piece of content, they would have never come through. You need to track this if you do content marketing.
Last click tracks whether a prospect converted right before a form submission. For example, they may have been sent your website by a friend, went through your blog, and then signed up. You still want to track those results as it indicates the blog content helped them make a decisions. Here’s how to set up this report:
1. Head to “Reports” and then “Create Report”
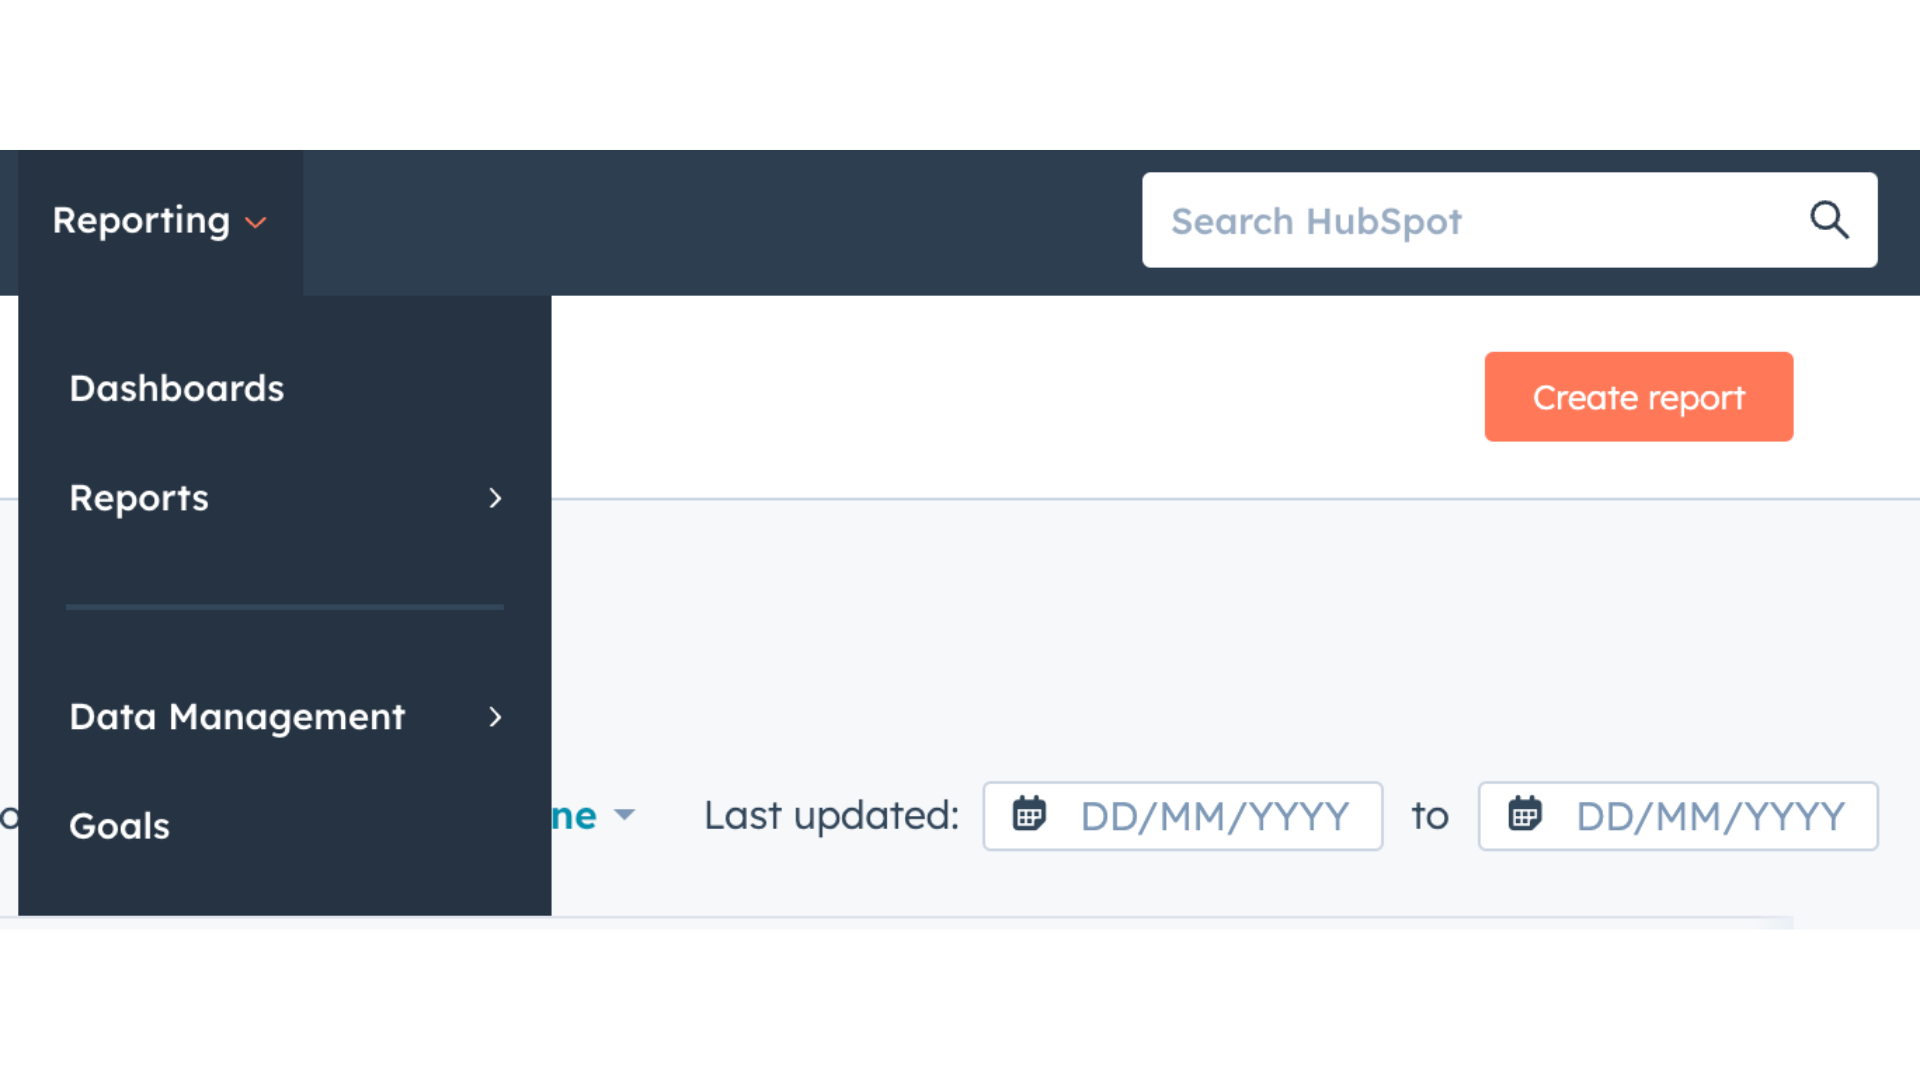
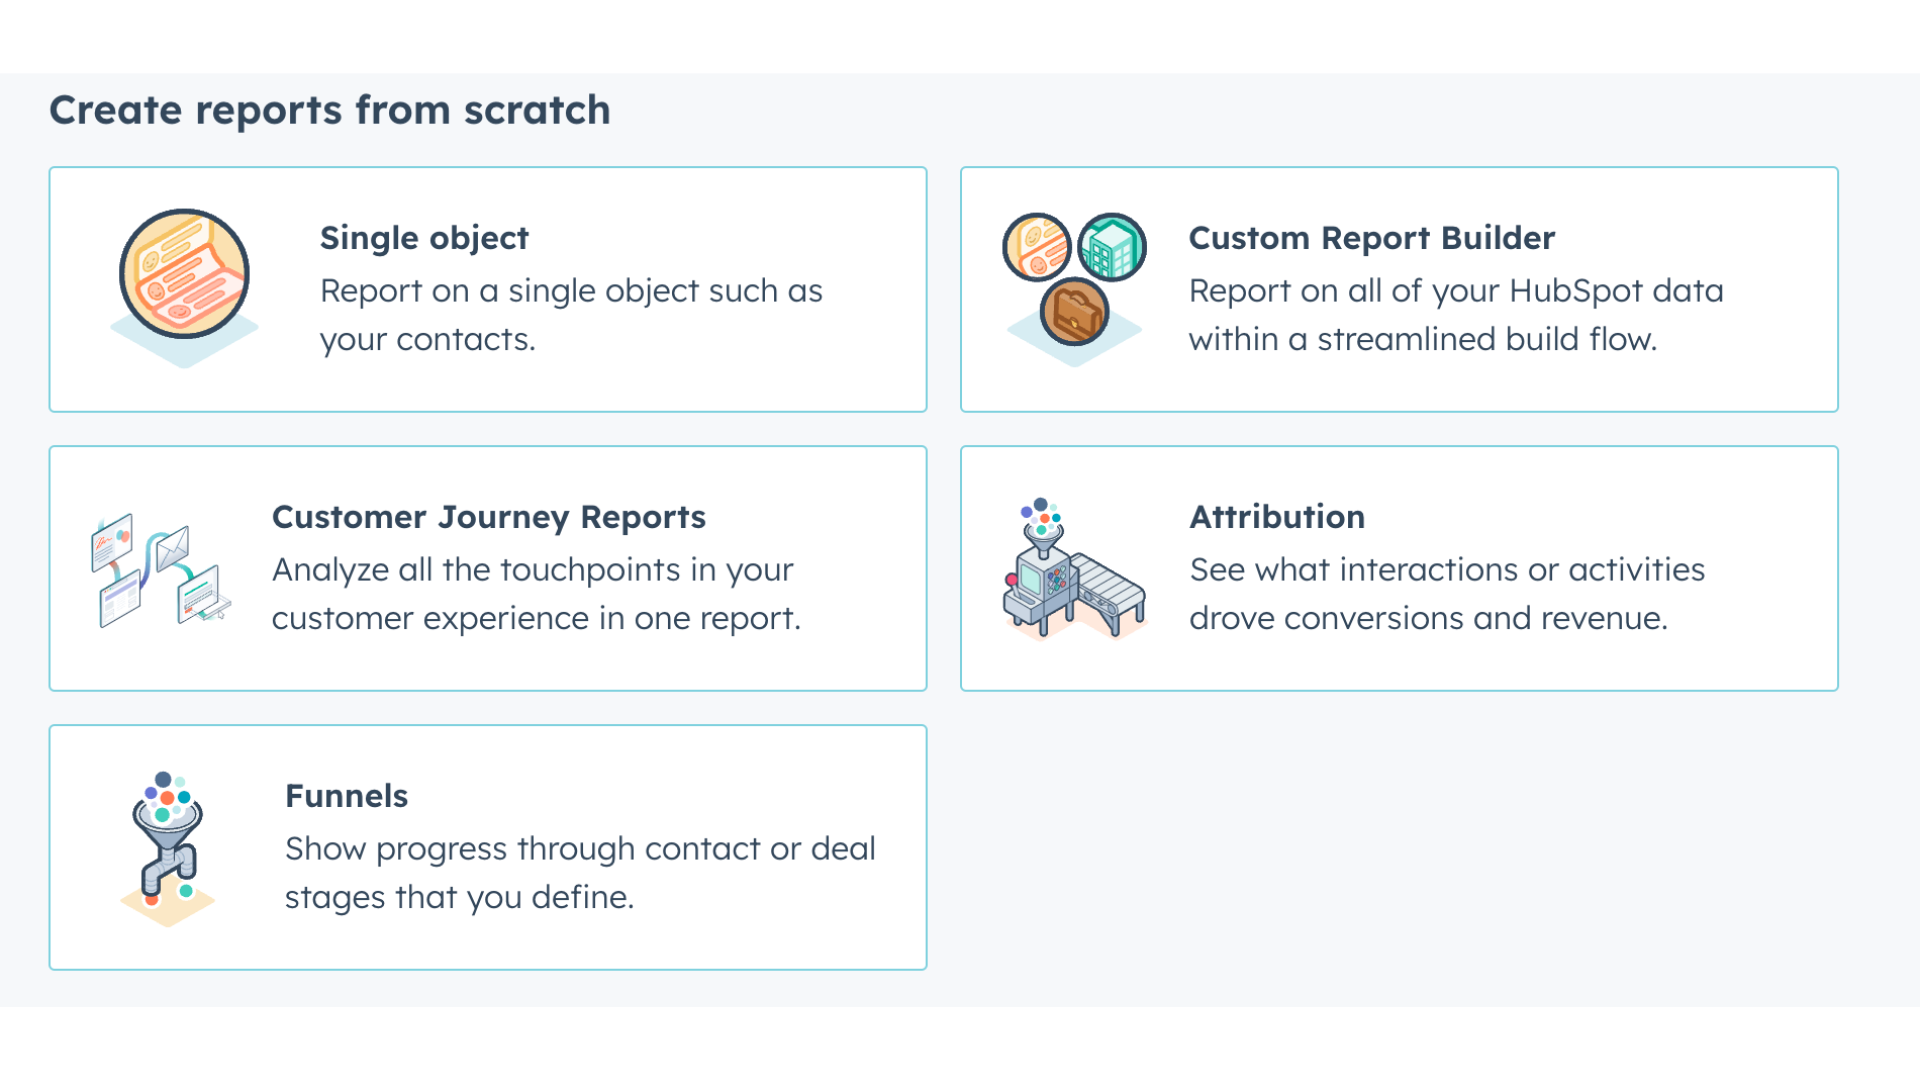
2. Click on “Single Object”
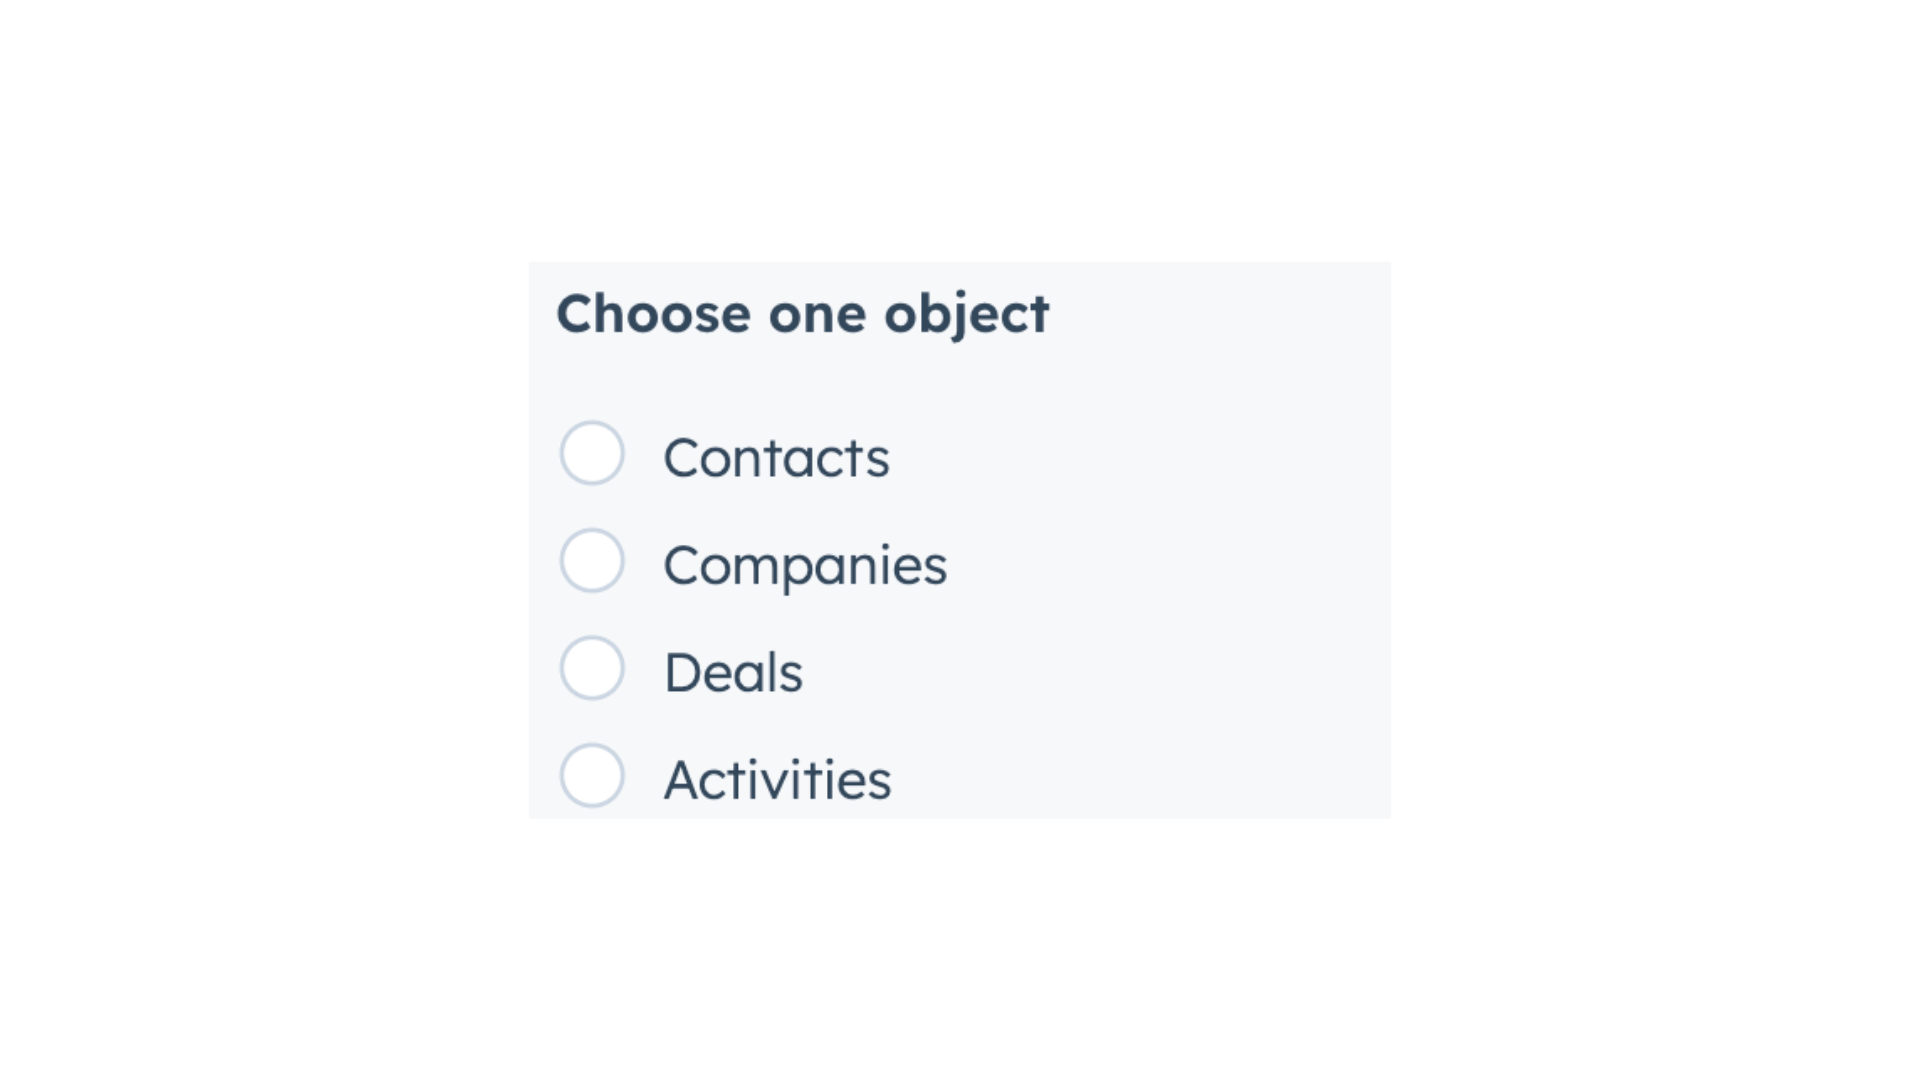
3. Click on “Contacts”
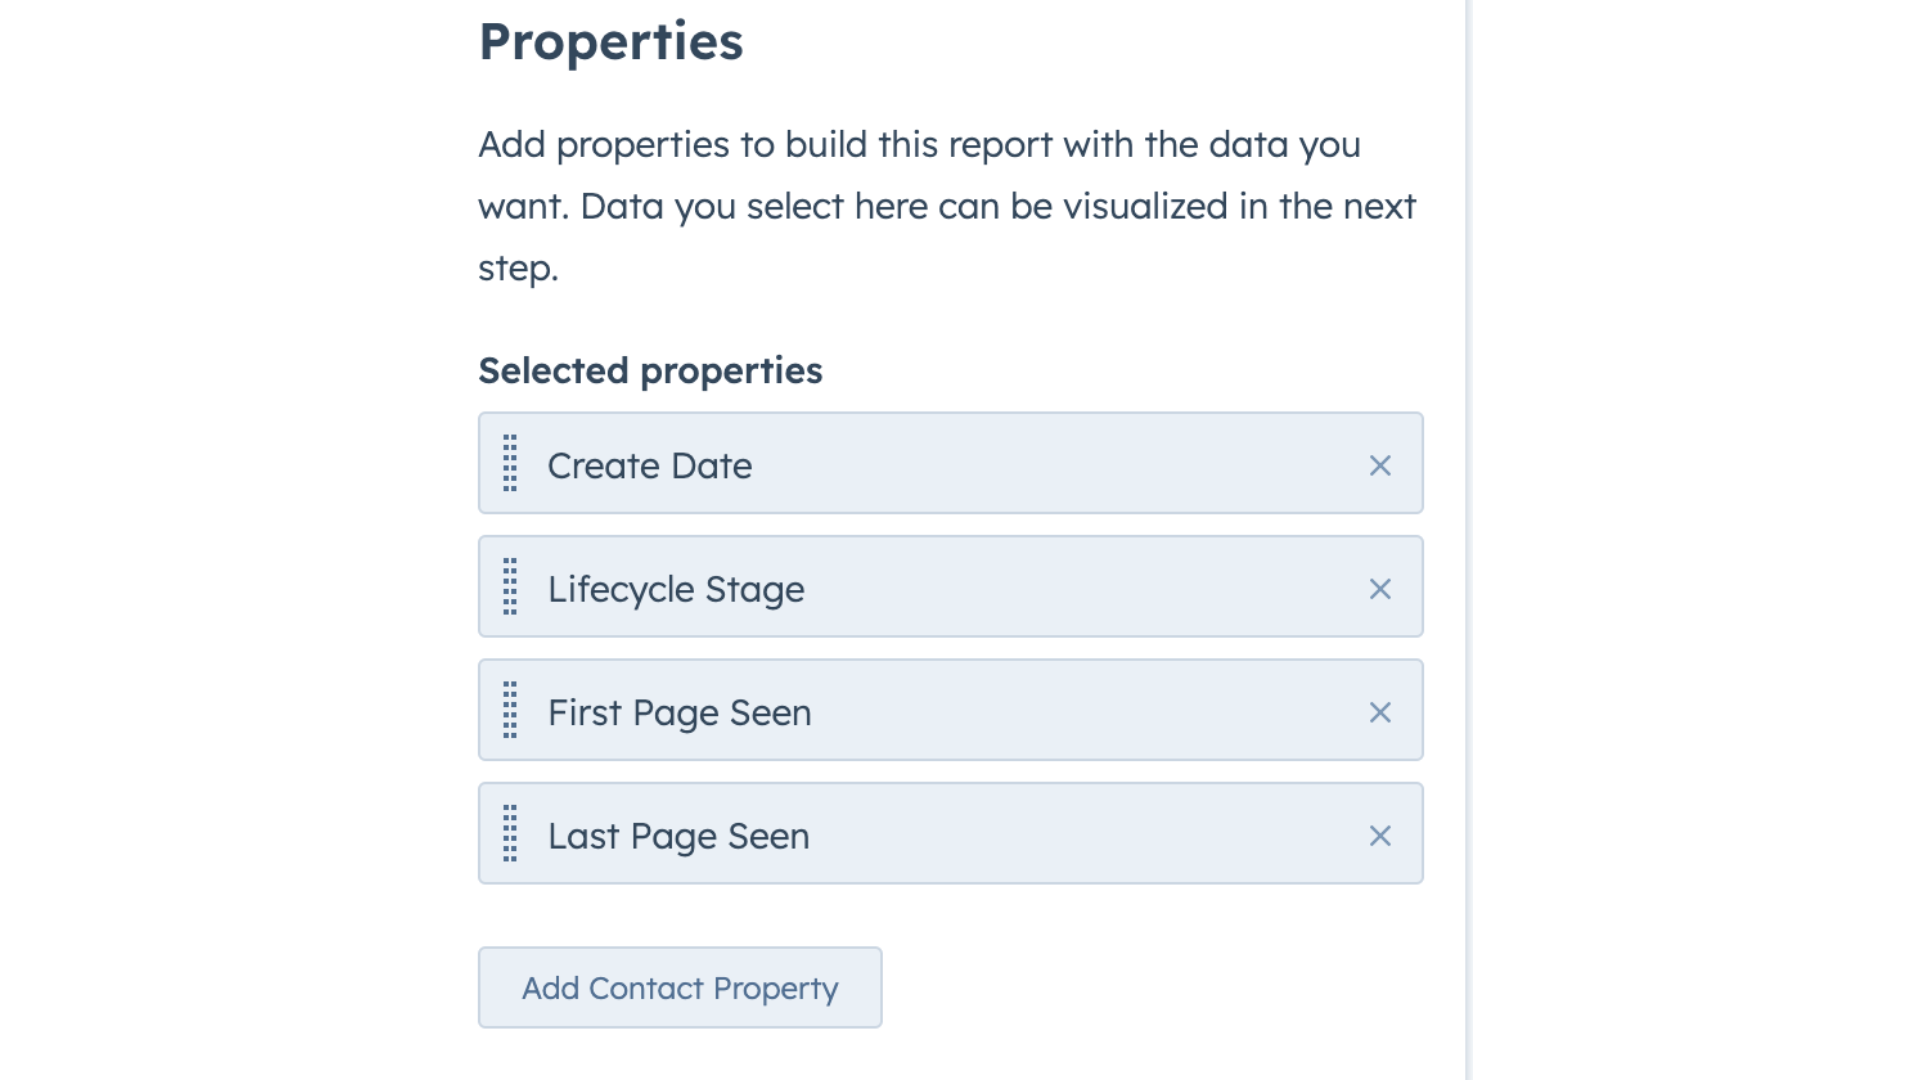
4. We’re now going to add a few properties. Add the property “First Page Seen”.
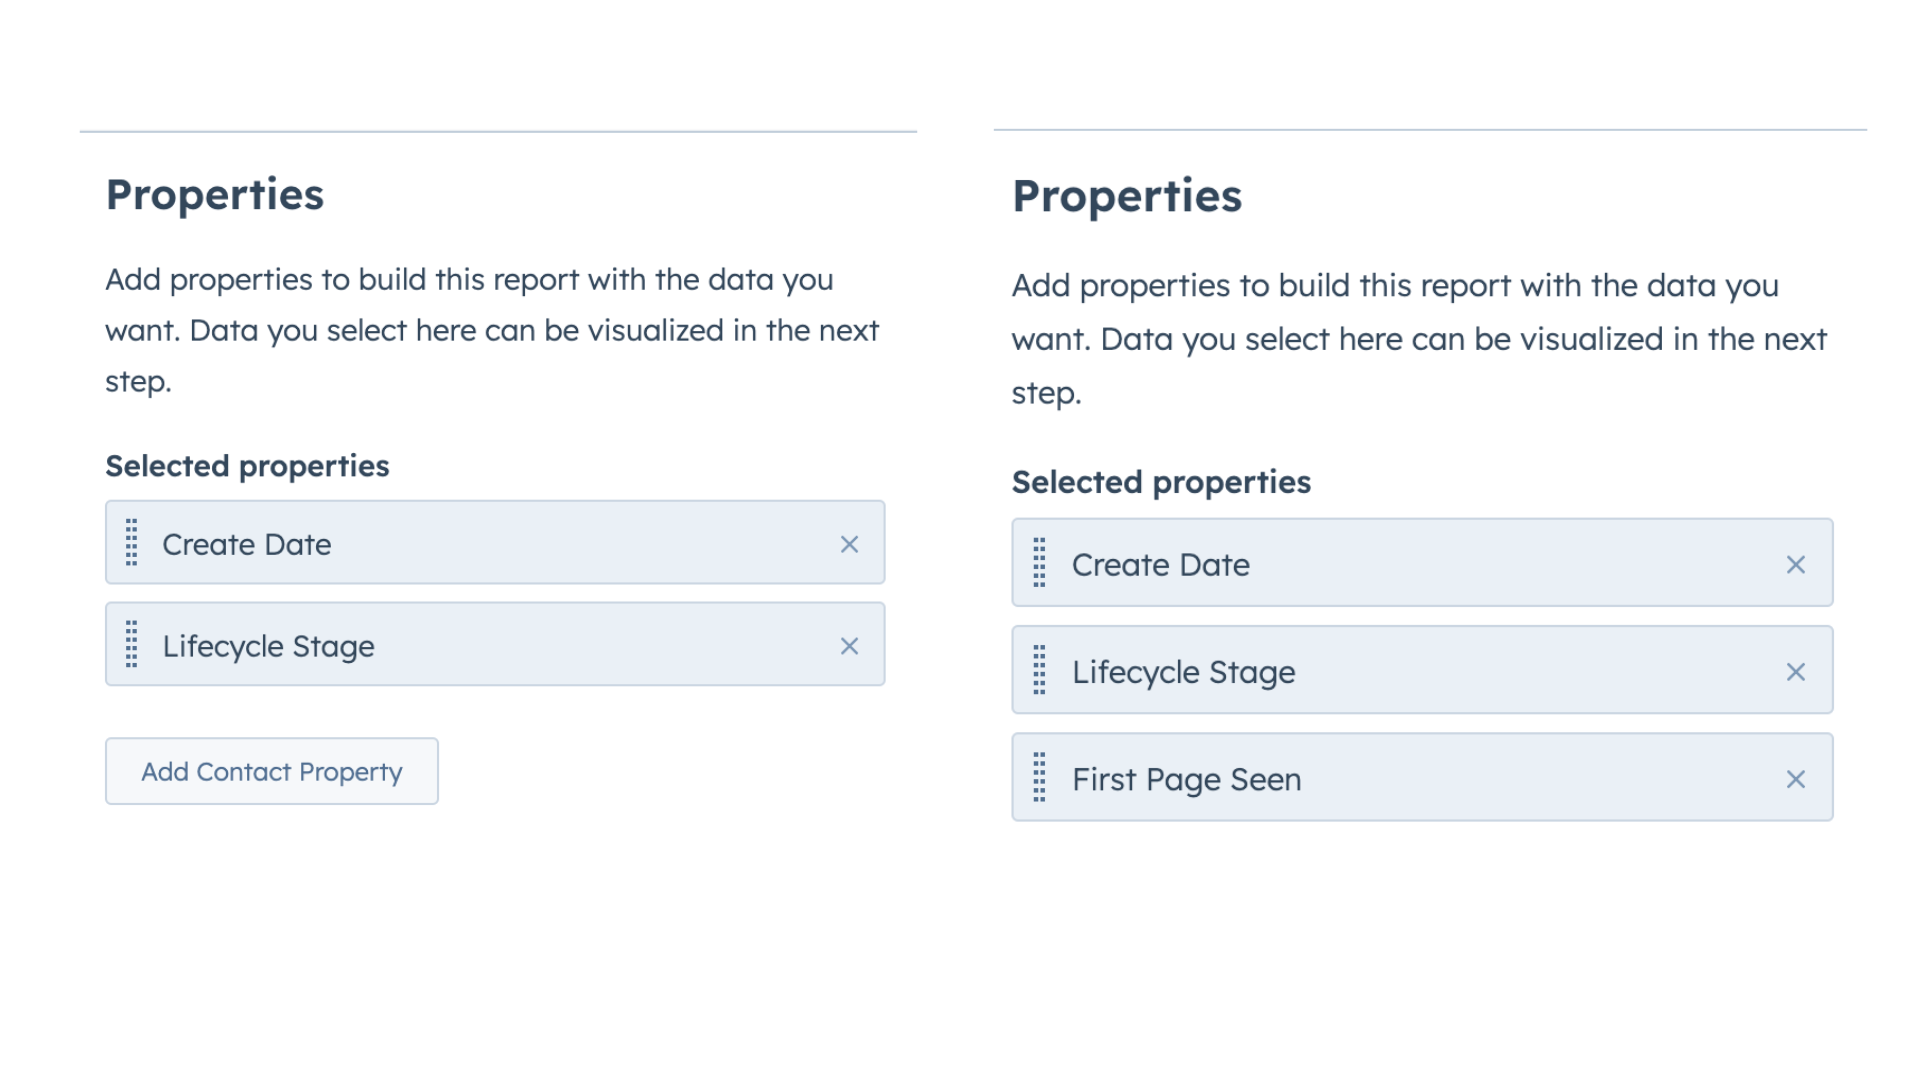
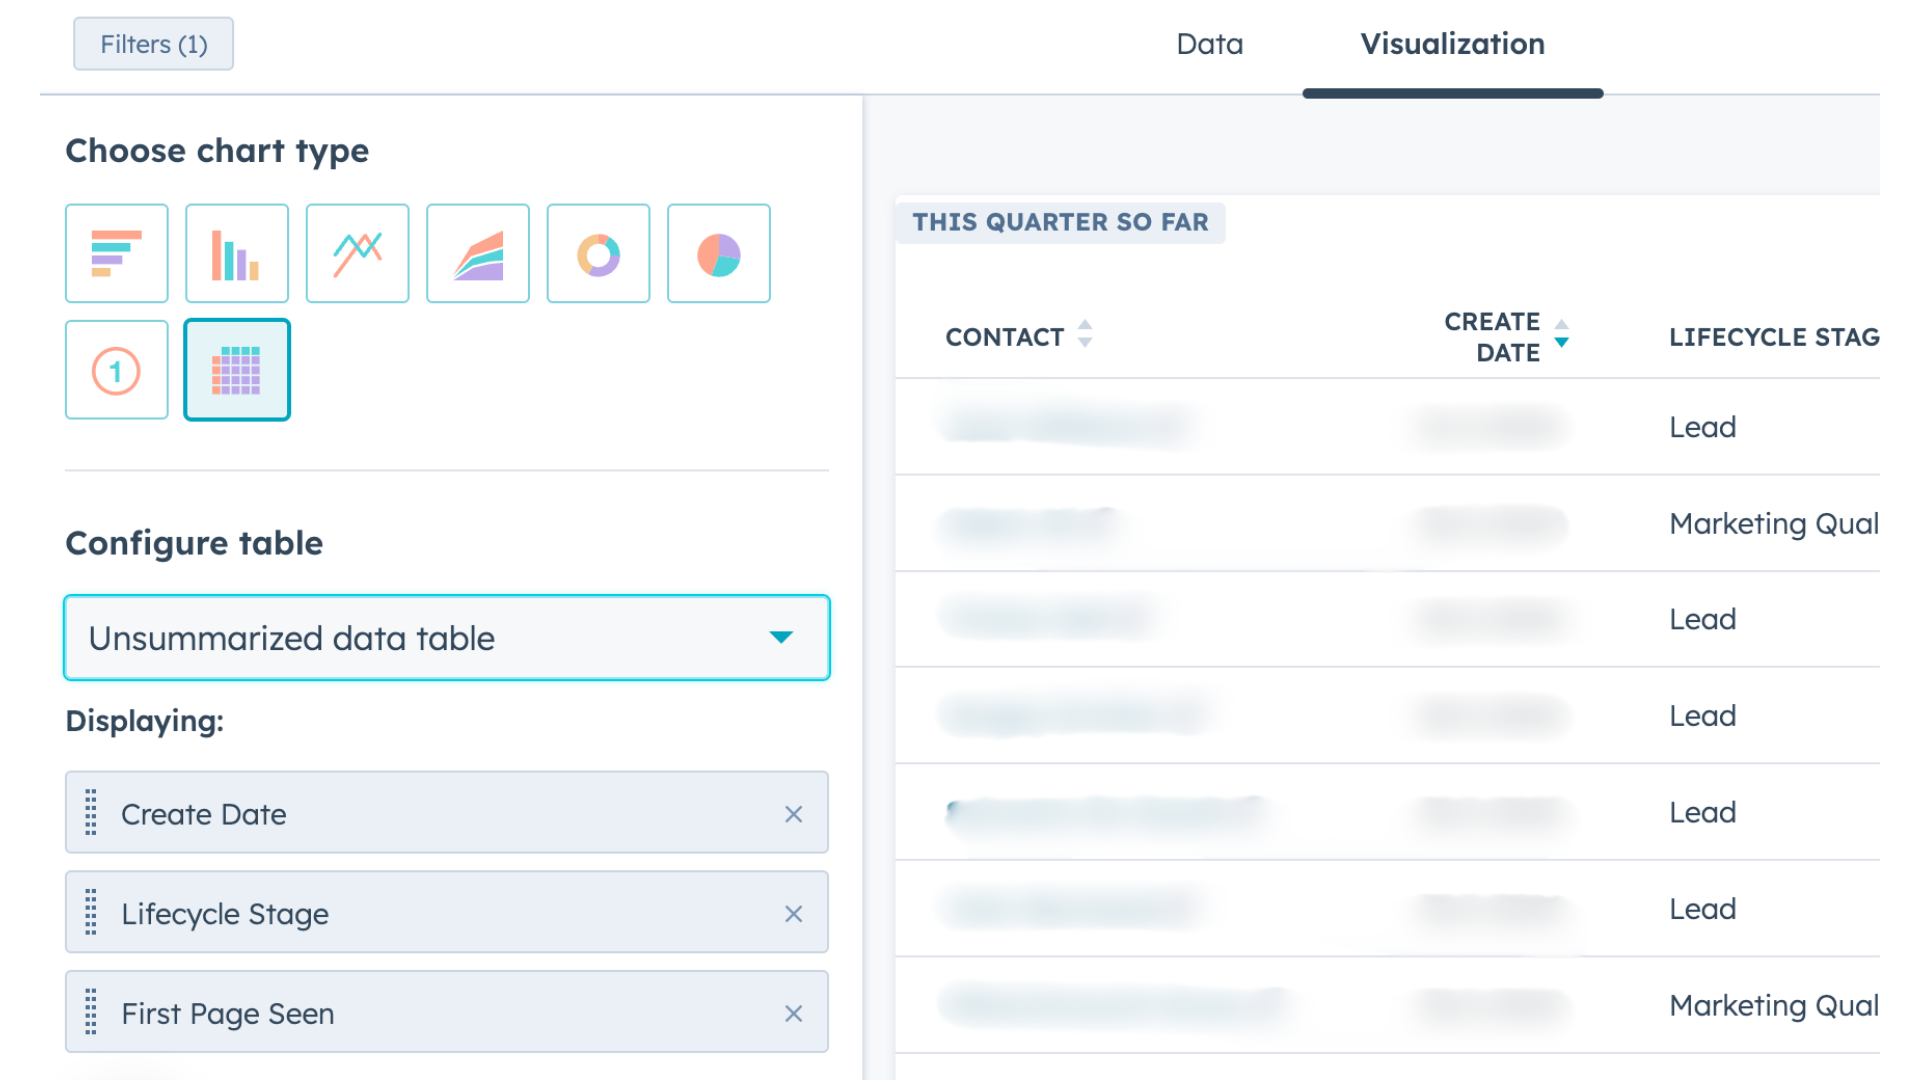
5. Now click on “Visualisation”, and then “Table”. Make sure table is “Unsummarised” and under “Displaying” you have these three properties included:
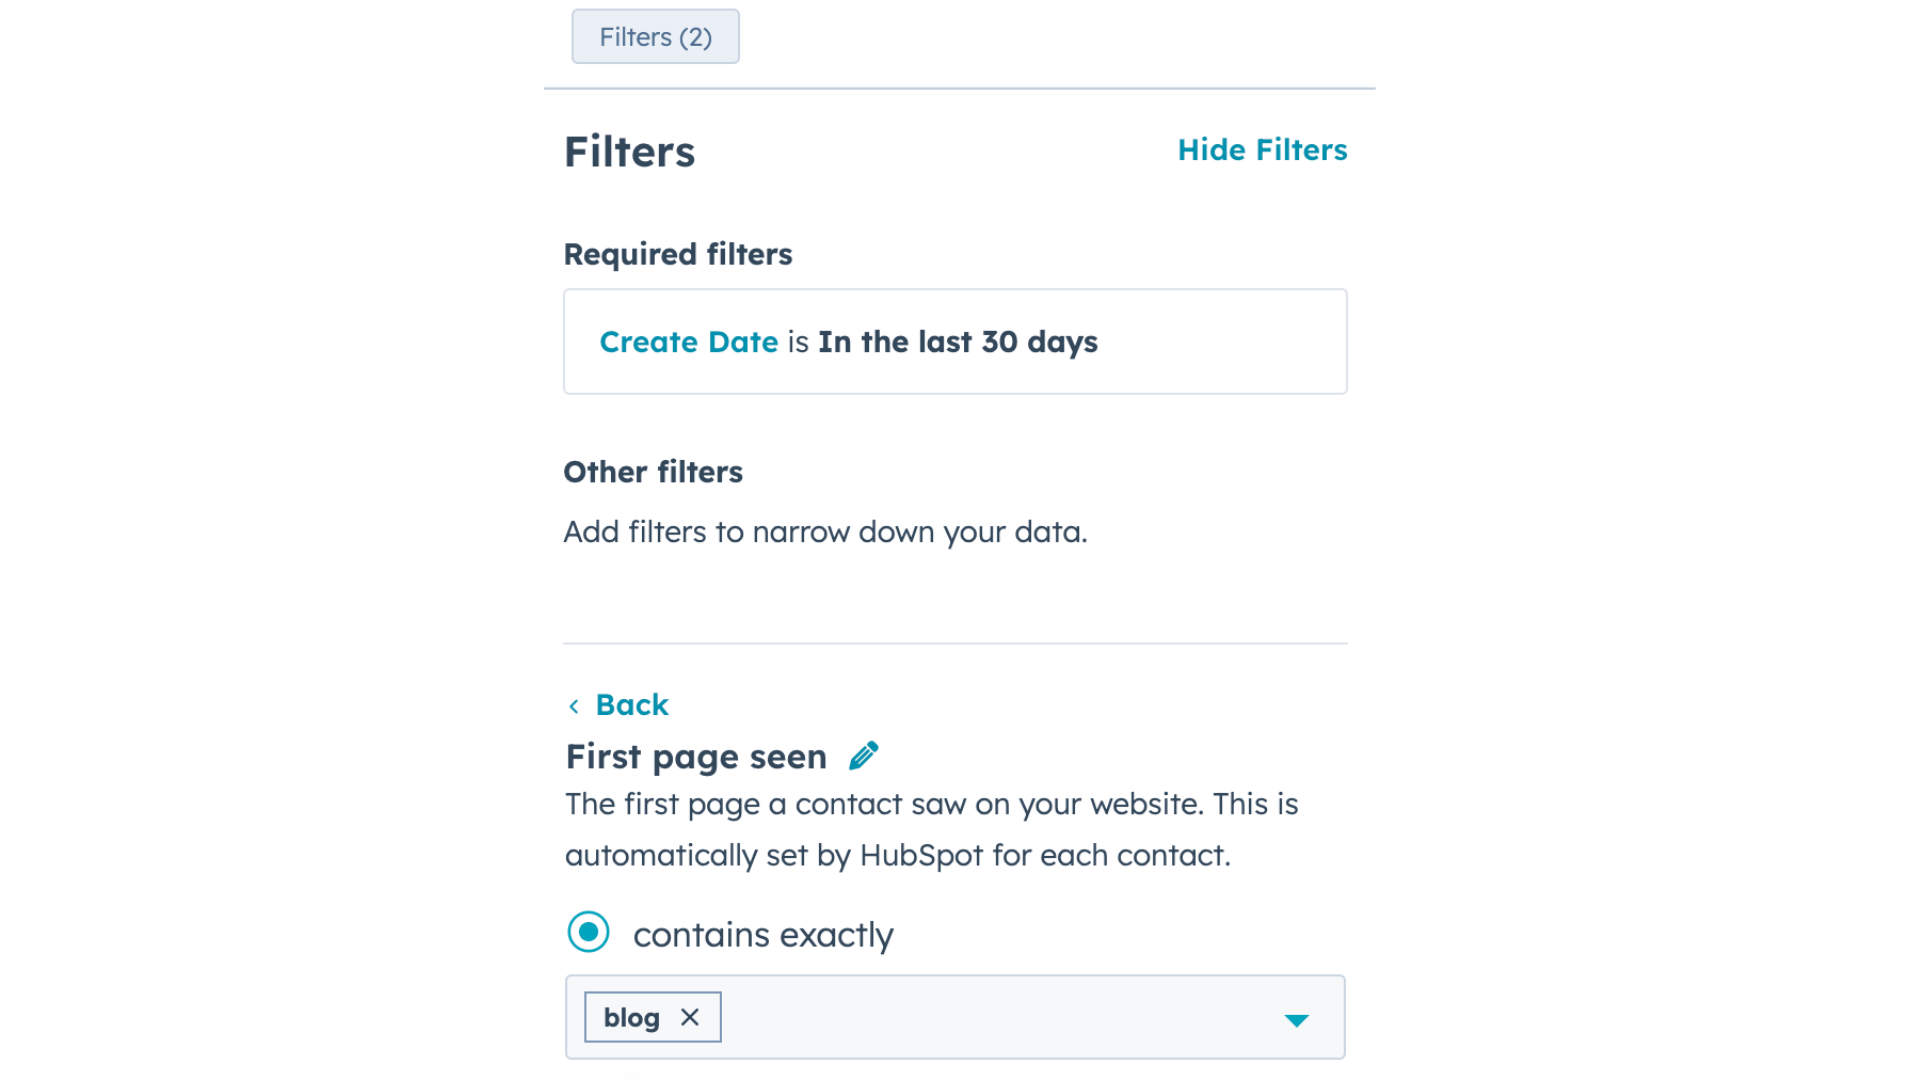
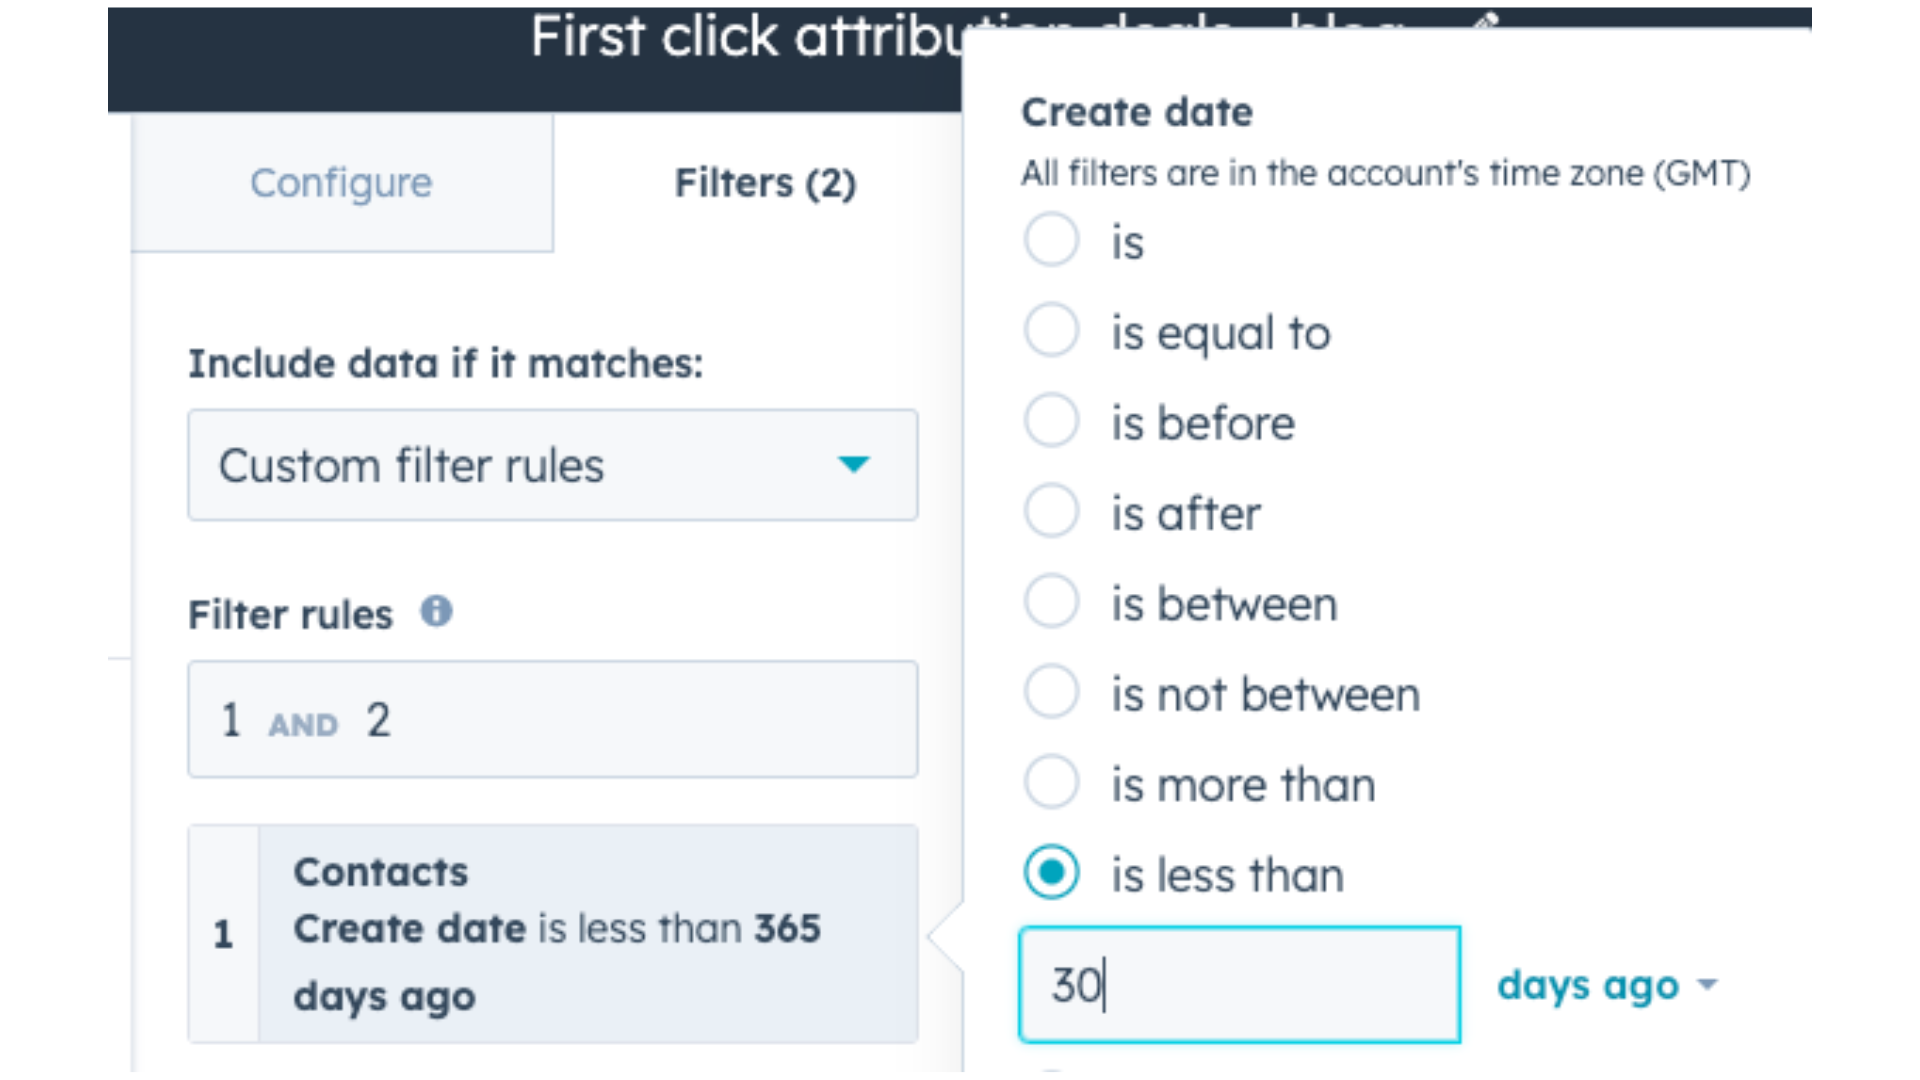
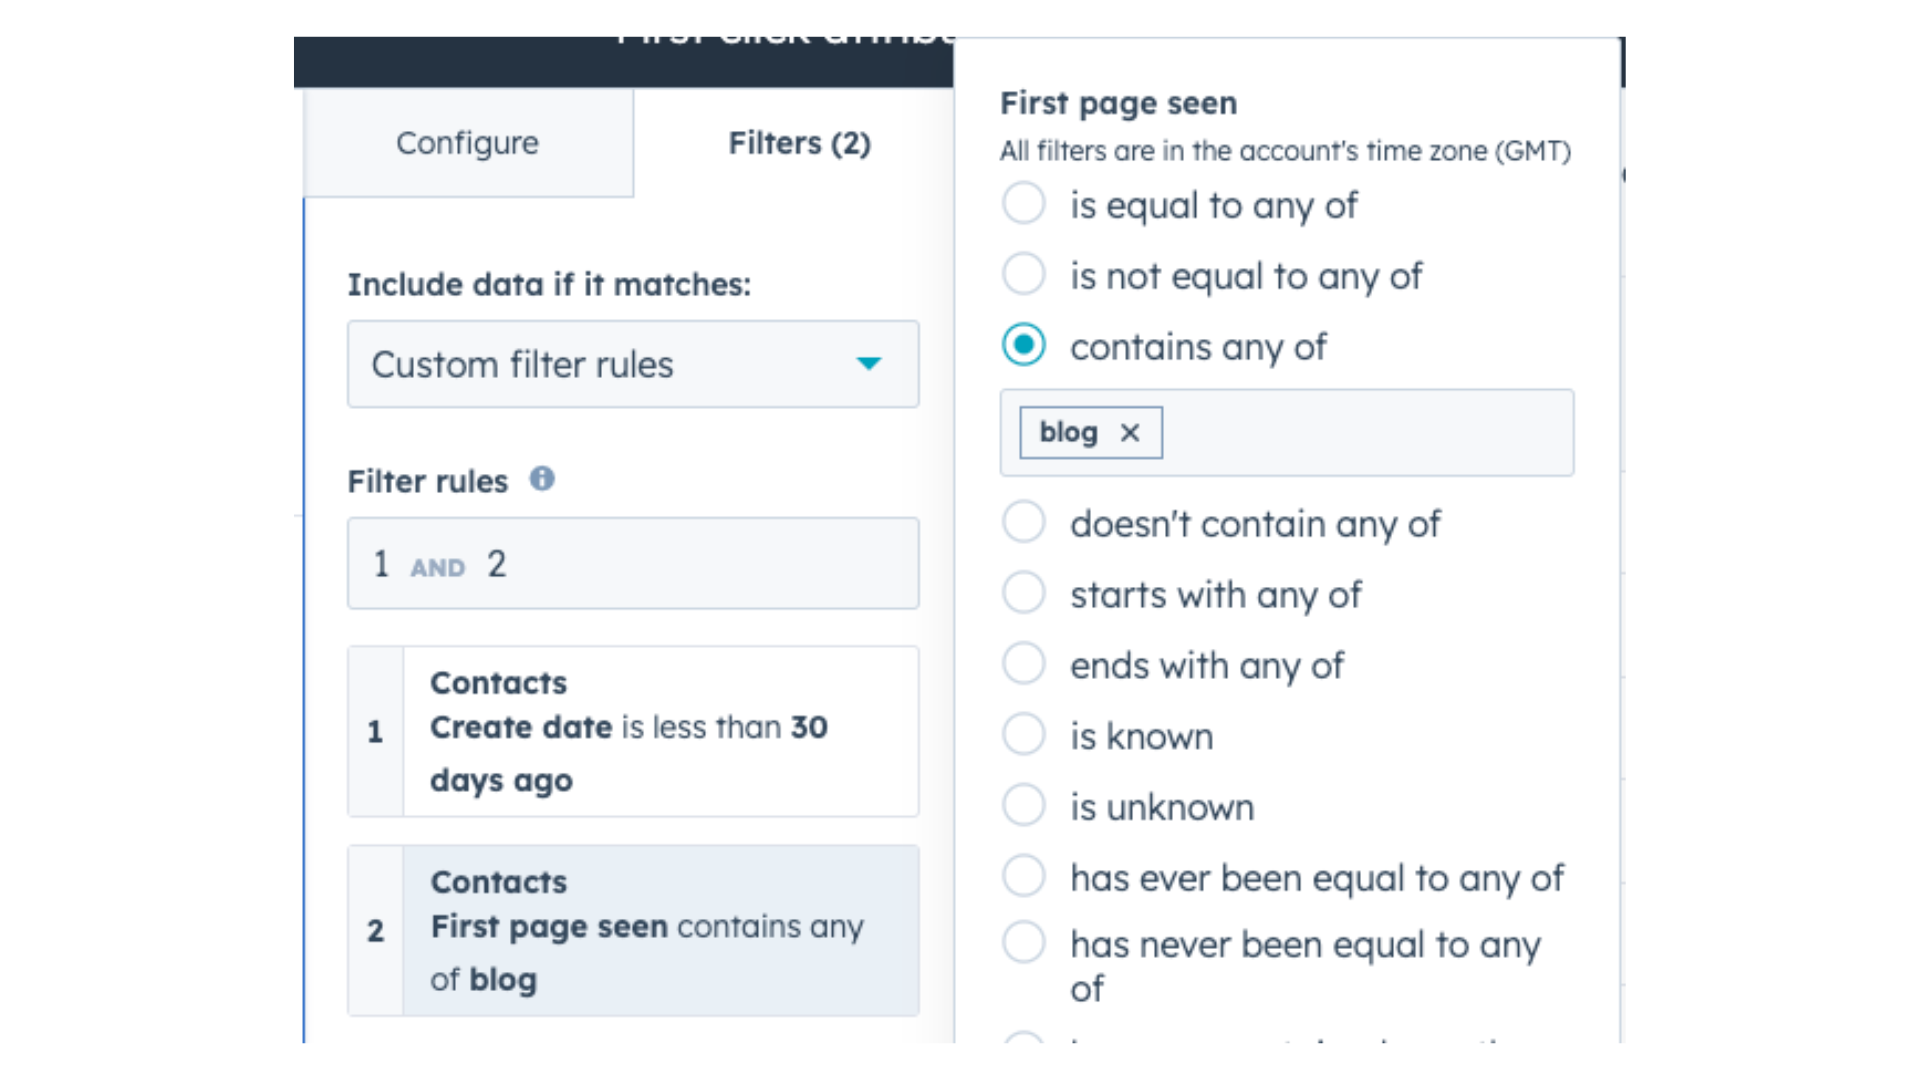
6. Click on filters, and set the “Create date” to last 30 days. Then include a “First page seen” filter to include “blog” (or any URL folder that you want to analyse).
7. Bingo! You can now see all the contacts that discovered your website via your content (and save it to a dashboard).
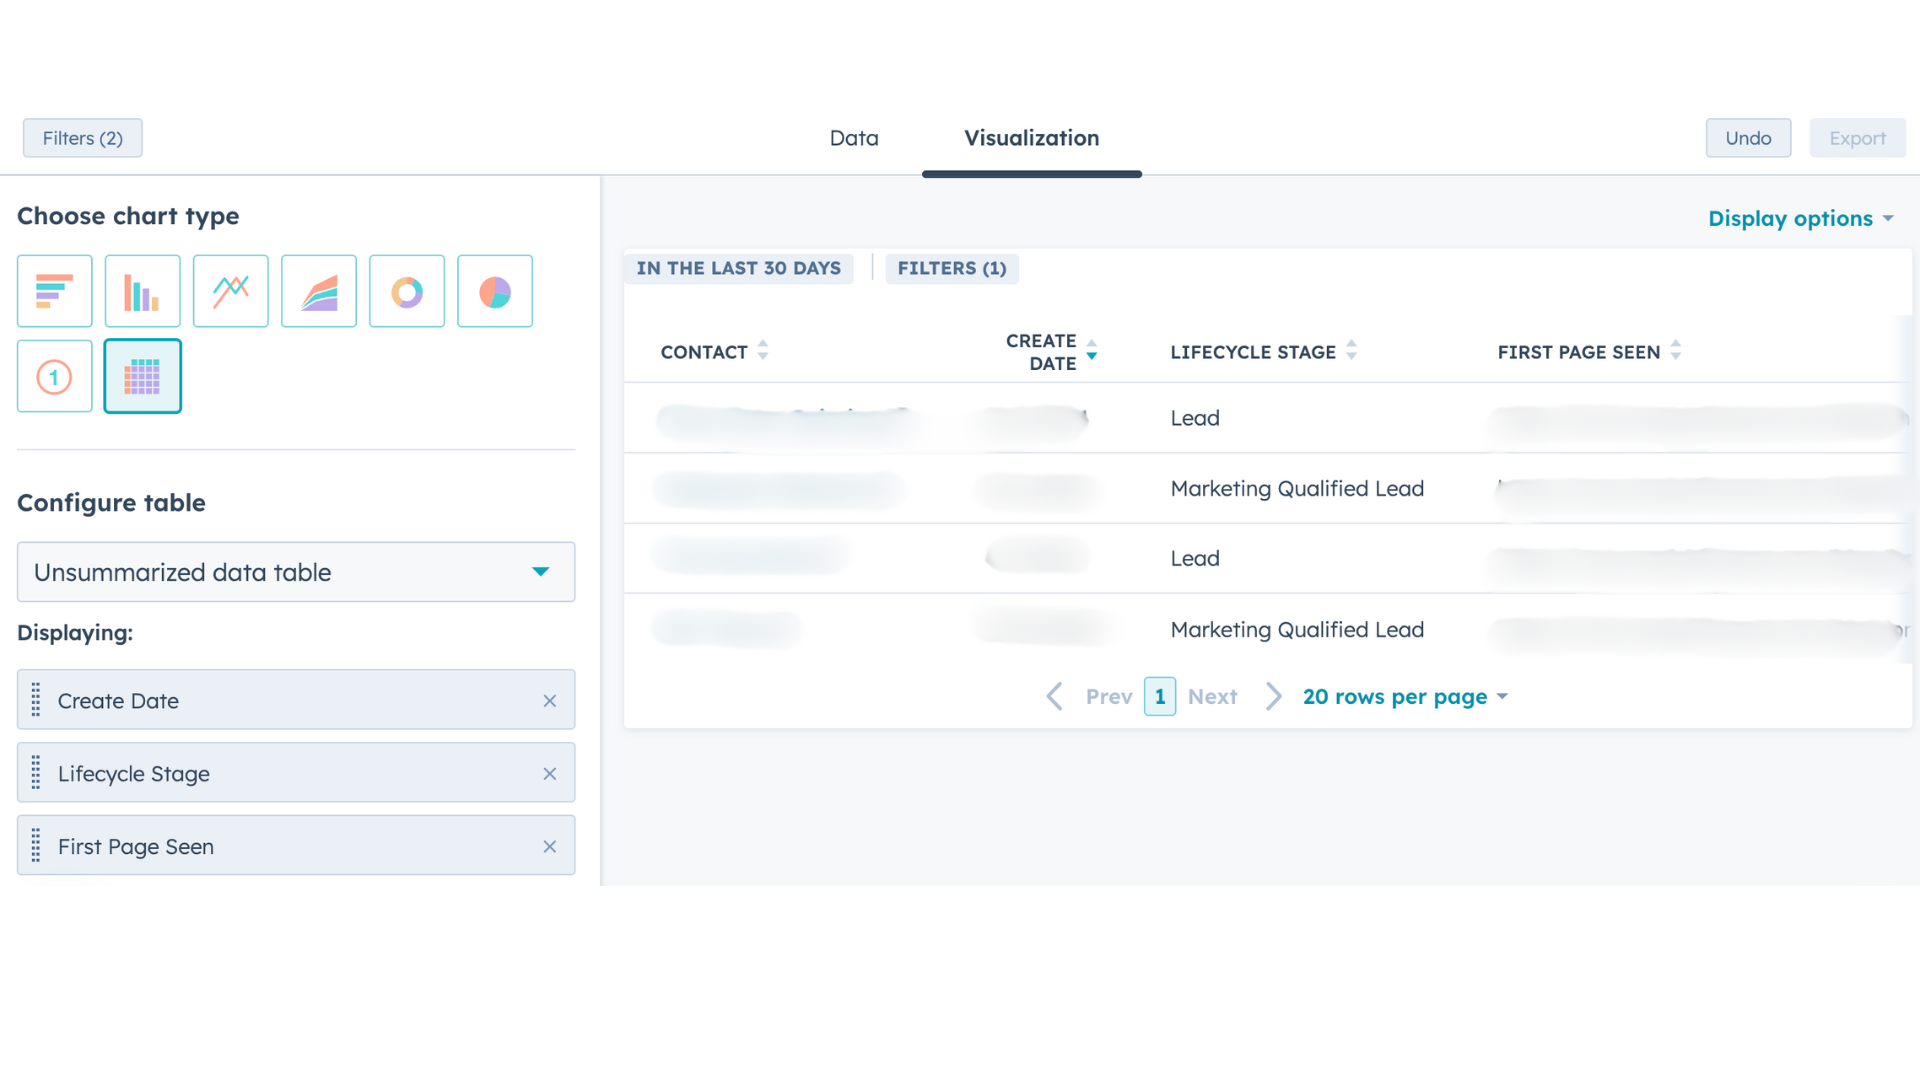
Once you’ve saved that report, you can go back and change the filter so that you only see “Last page seen”. These two reports will allow you to see first and last click conversions on the blog.
You can also play around with other properties, such as:
- Original source: where did these contacts come from?
- Deal stage: what stage are they at now?
- Newsletter: are they signed up to your newsletter?
What does this report do?
It allows you to track how many contacts discovered your website via the blog, as well as how many converted right after reading one of your blogs. Take note that this is just contacts, not deals or revenue. You still don’t know the quality of those contacts (although you can click through and check manually to take a peak). But it’s a good place to start. With first click attribution report, you can confidently say that your content helped bring in XX new contacts last month.
Now let’s look at how this translates to $$.
2. Report: Revenue per piece of content
HubSpot can be your CRM only
This report allows you to see at a glance how much revenue you’ve influenced. It works if HubSpot is your CRM, but it can only work if your sales team is inputting numbers into HubSpot, or a tool that integrates with HubSpot (e.g. Salesforce).
Like in the previous report, we’re going to set up both first click and last click attribution so you can compare and contrast easily. Also make sure you have the right permissions so you can see those numbers. If you don’t, explain to your admin/team why it’s important to get access to that data:
1. Head to “Reports” and then “Create Report”
2. Click on “Custom Report Builder”
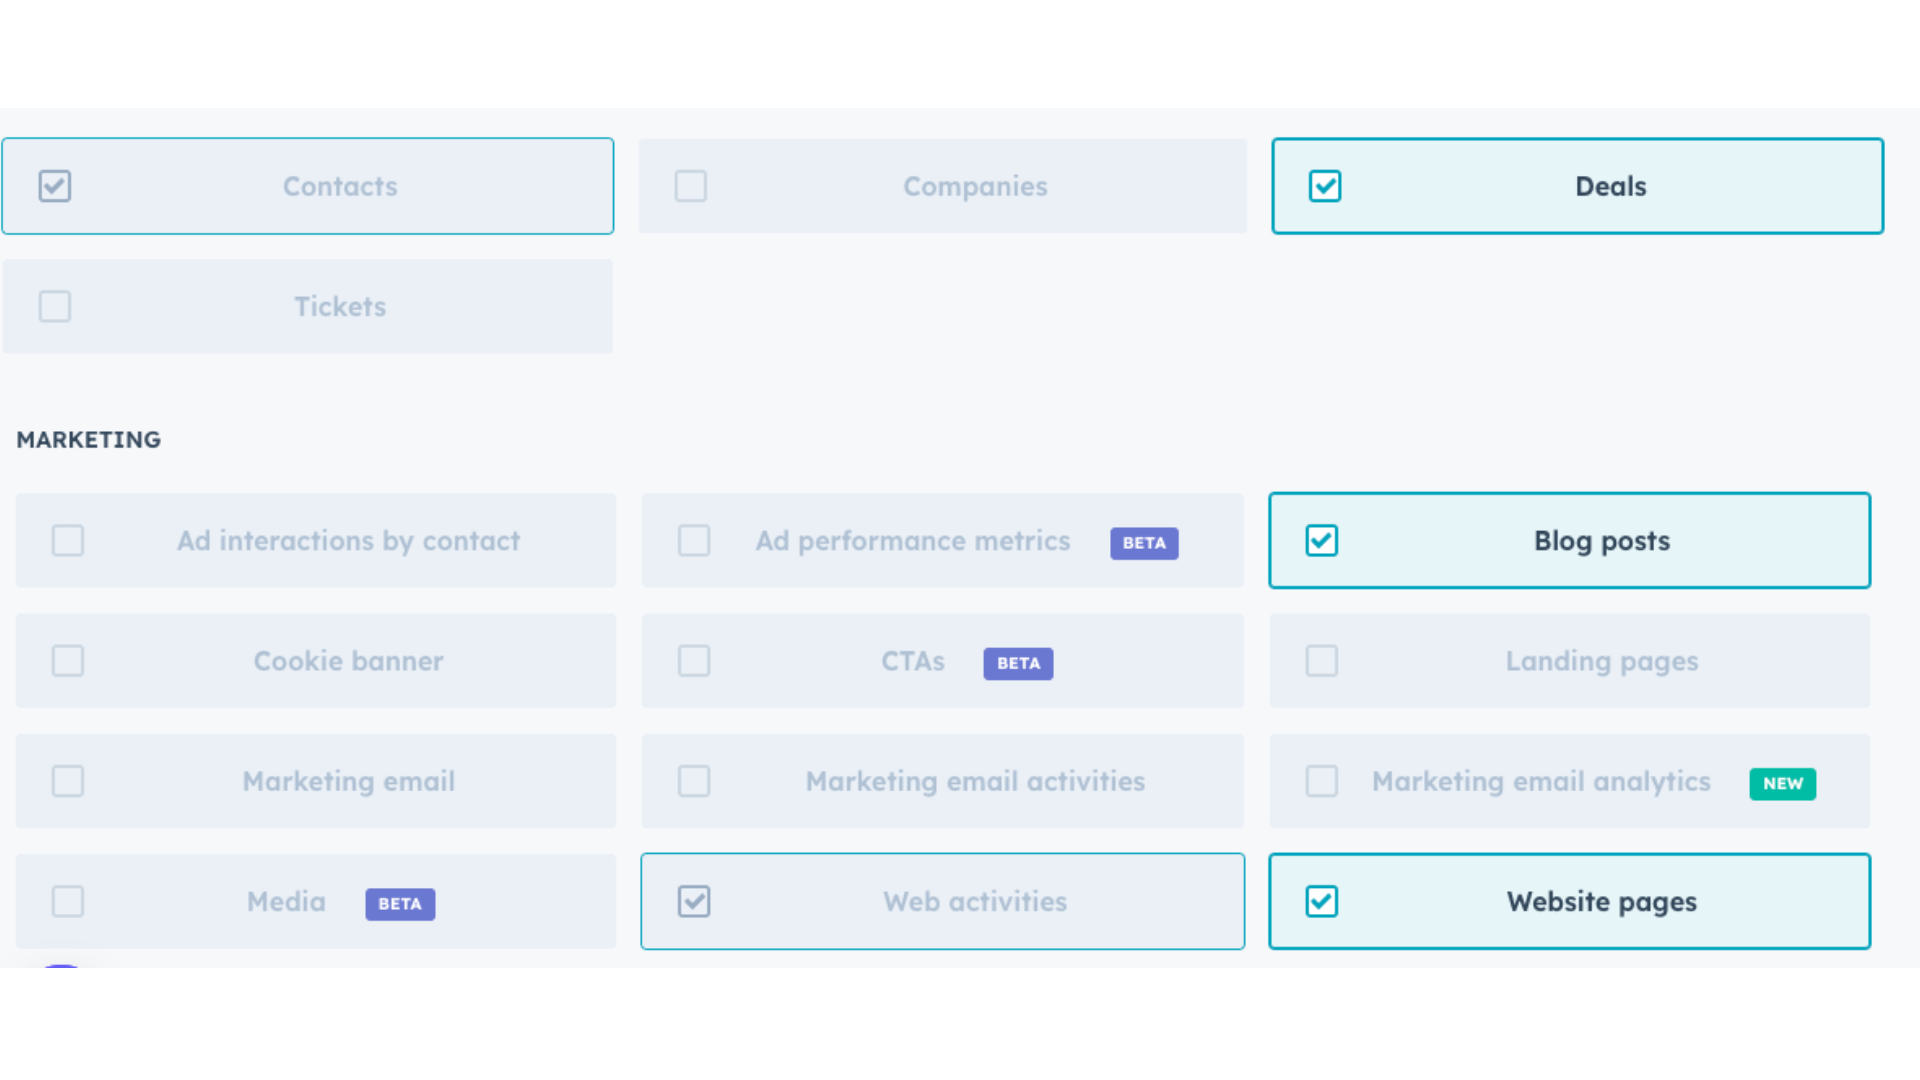
3. Make sure “Contacts”, “Deals”, “Blog posts”, “Web activities” and “Website pages” are selected. If some of them are greyed out due to your plan, you want to make sure the following are selected:
- Contacts
- Deals
- Web activities
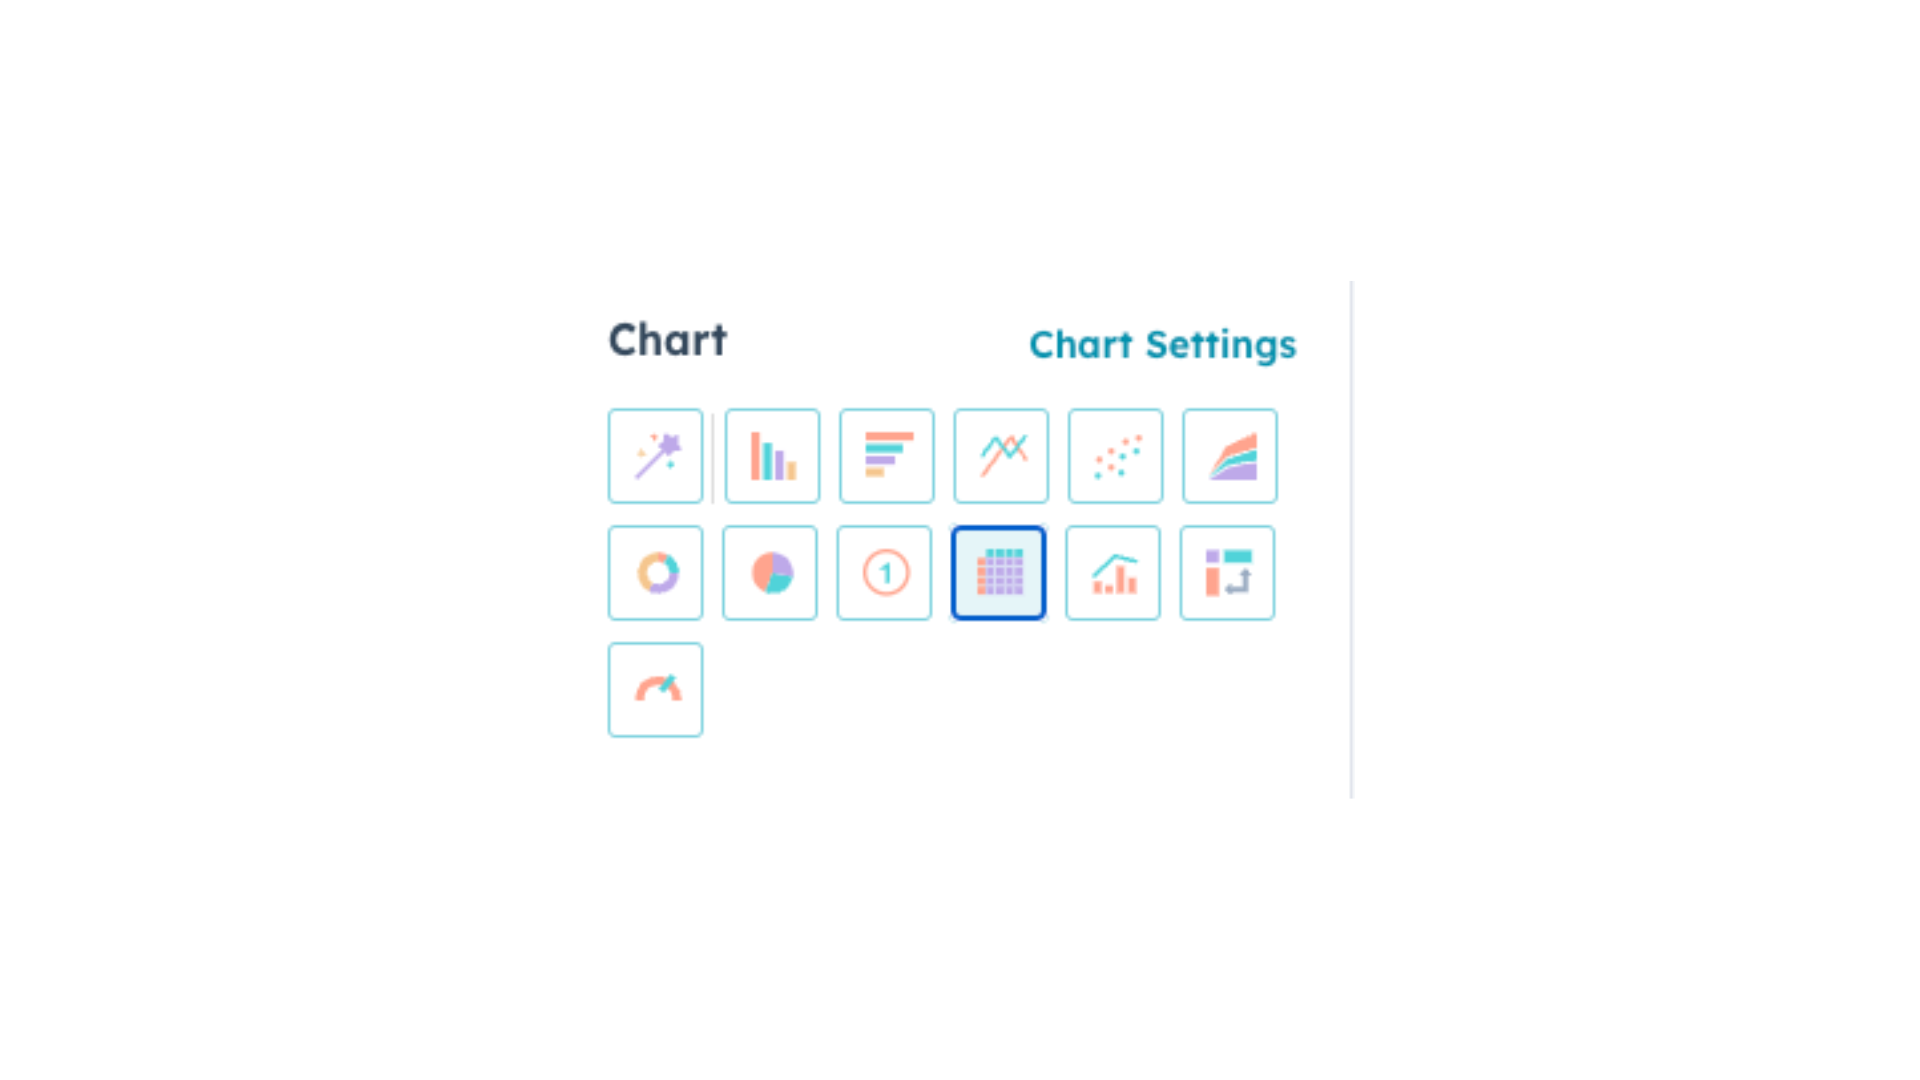
4. Select the table chart (we always find this format makes it easier to build the report, you can always adjust later on)
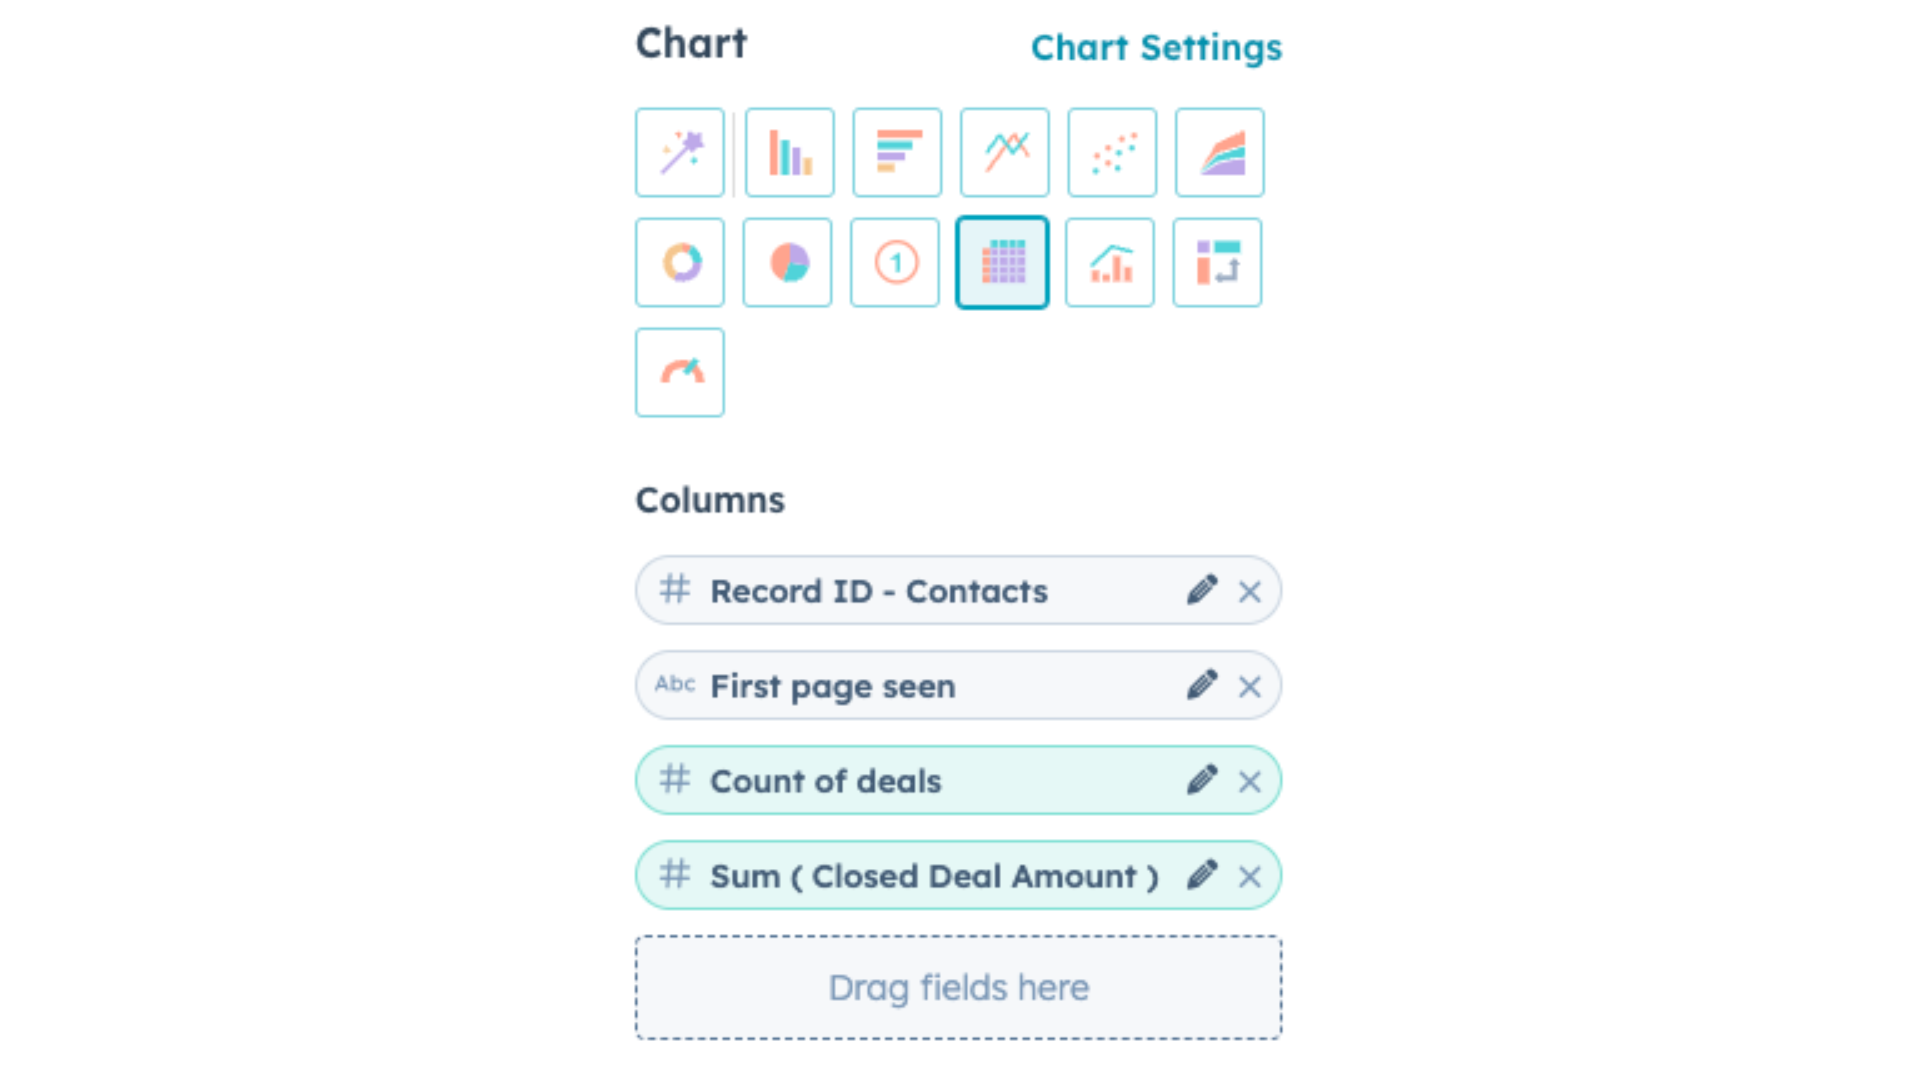
5. Under “columns” you’re going to want to add 4 properties:
- Record ID - Contacts
- First page seen
- Count of deals
- Closed deal amount
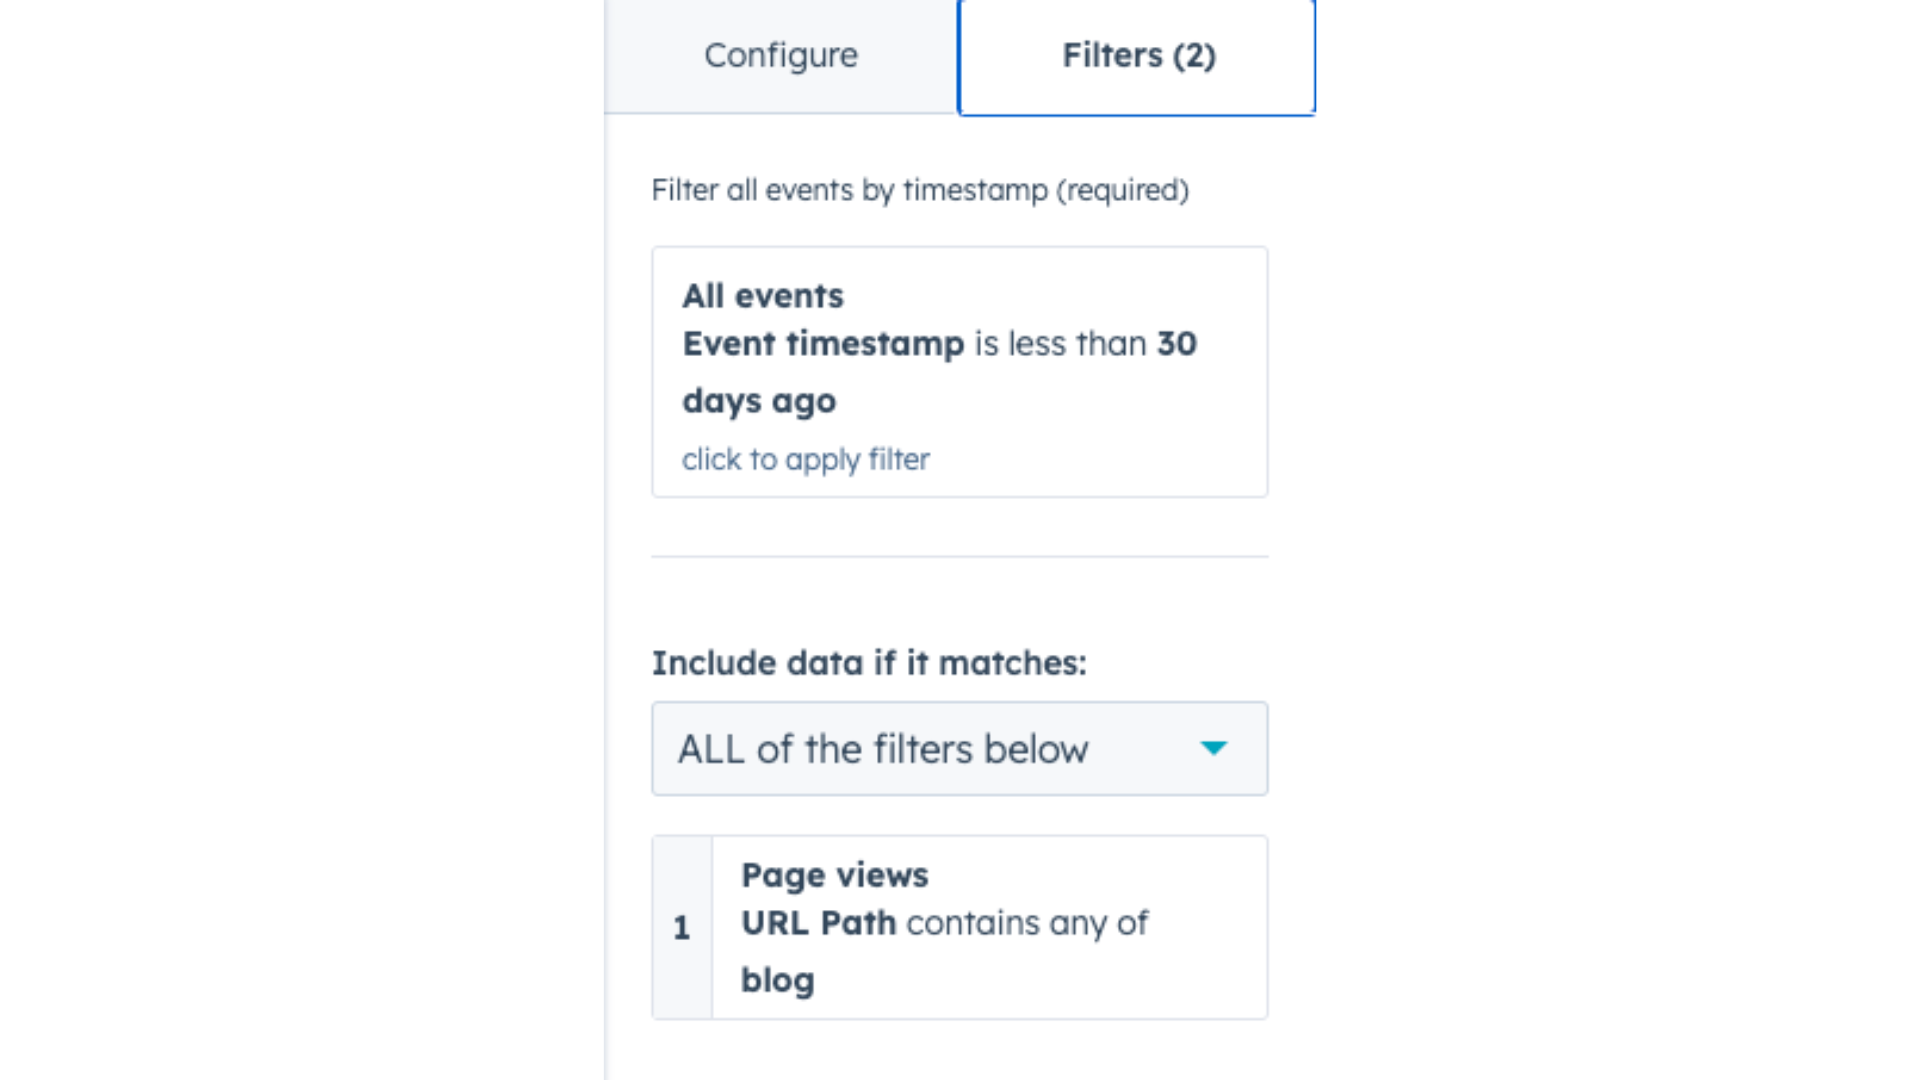
6. Click on filters and adjust the Event timestamp to what time range you’d like it. Usually we like it at “less than 30 days ago”
7. Under the filters section, drag the property “First page seen”. Click on it, and then select “contains any of” and add in “blog” (or the subfolder you use for your content)
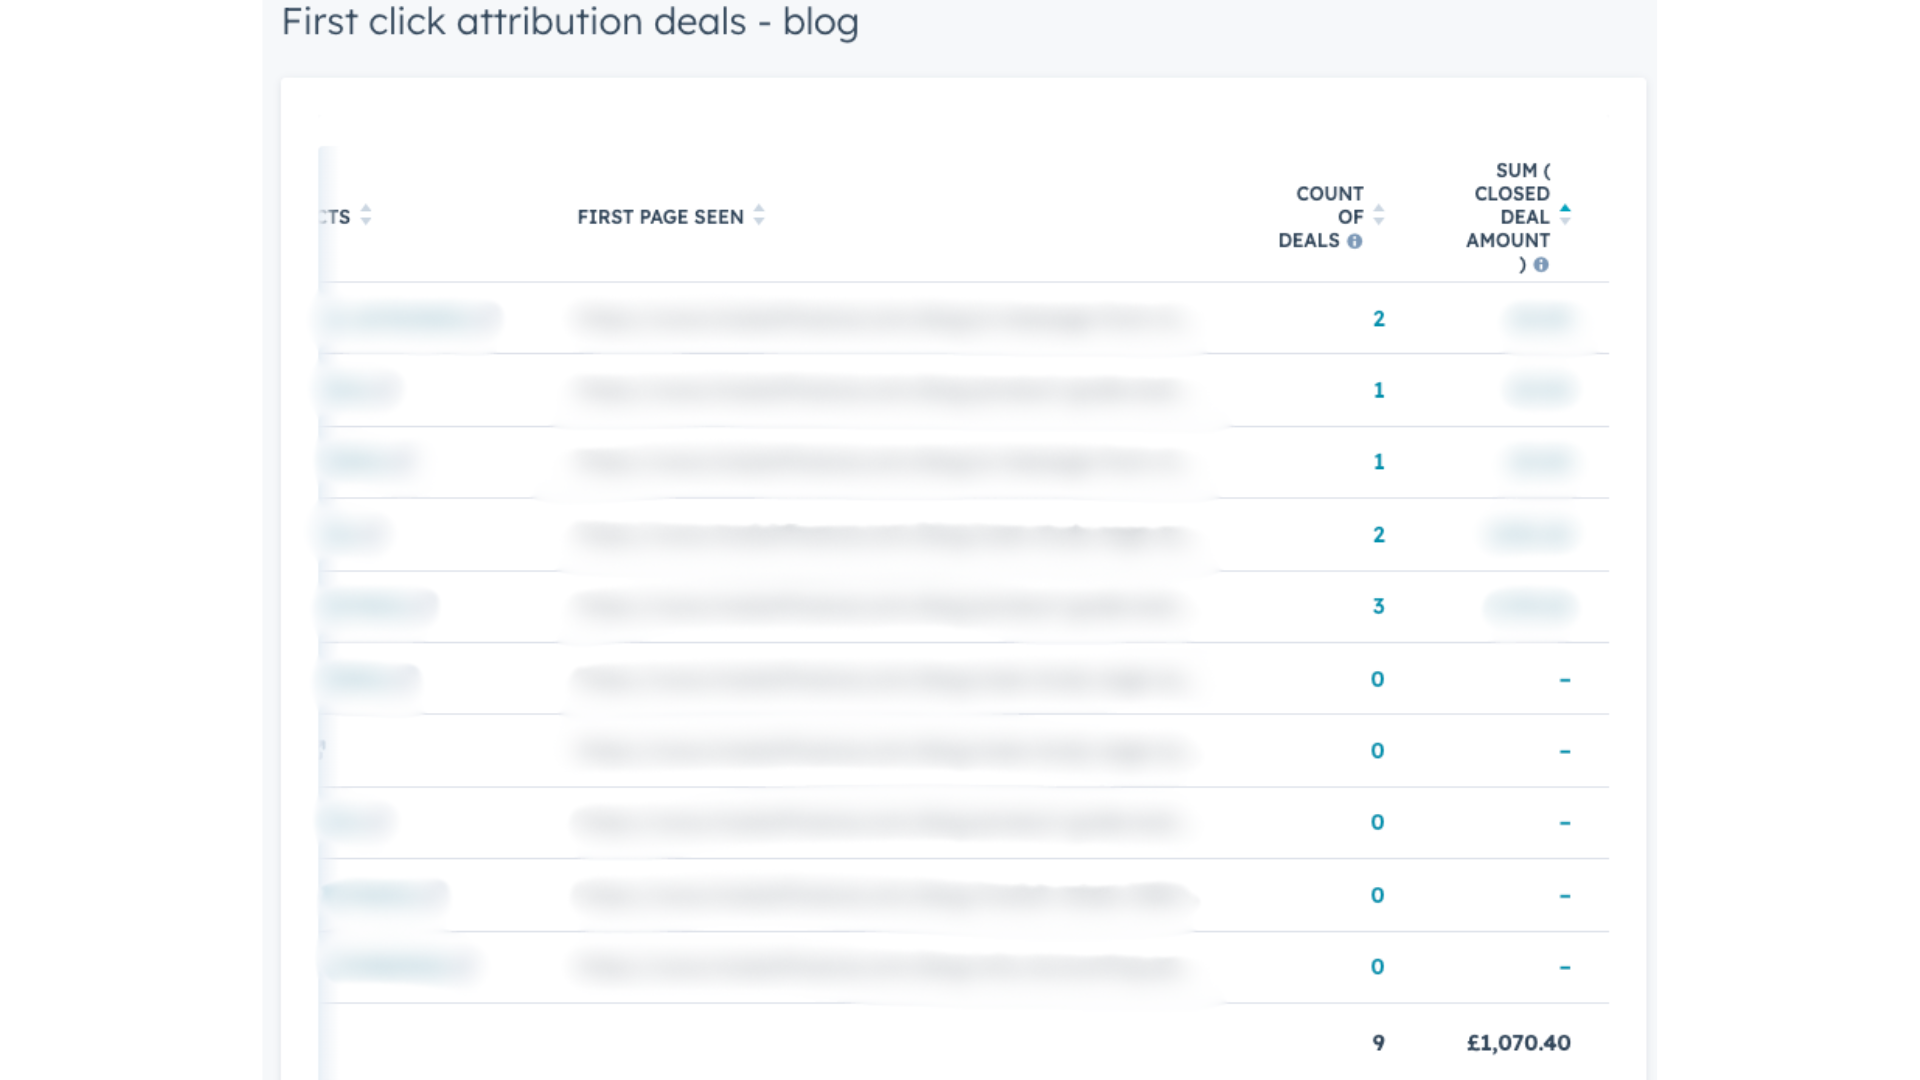
8. That’s it! Once you save, on your right you’ll see how many people had the first page seen as one piece of content, how many deals it created, and the total revenue. Once you save it as a report, you can see it on your dashboard. Pretty cool huh?
Some tips:
- If nothing comes up, set the timestamp to last 365 days so you can double check the data is coming through.
- If you want to see revenue generated with last click attribution, simply add the property “Last page seen”, change the filter (make sure to remove first page seen) and then save as a separate report. The revenue numbers will be different, so make sure to report on both
What does this report do?
It allows you to report on revenue with financial numbers. This allows you to see at a glance which leads are reading your content and helping your company bring in revenue, which you can then report on.
3. Report: Influenced contacts via blog
HubSpot can be only your CRM
Another report you want to set up is one that allows you to track how many contacts are reading your content in general. This isn’t directly tied to revenue, but it allows you to prove that people are actually reading your content and influencing deals.
This report will track if someone discovered your website via an ad, read your content, clicked on another ad, and then maybe reached out to your founder on LinkedIn. No matter what their journey was, if they visited a blog at one point in time this report will track that.
This report is especially good if it’s still early on in your content programme and you want to be able to report on something. Here’s how to set it up:
1. Head to “Reports” and then “Create Report”
2. Click on “Custom Report Builder”
3. Make sure “Contacts”, “Deals”, “Blog posts”, “Web activities” and “Website pages” are selected. If some of them are greyed out due to your plan, you want to make sure these are selected:
- Contacts
- Deals
- Web activities
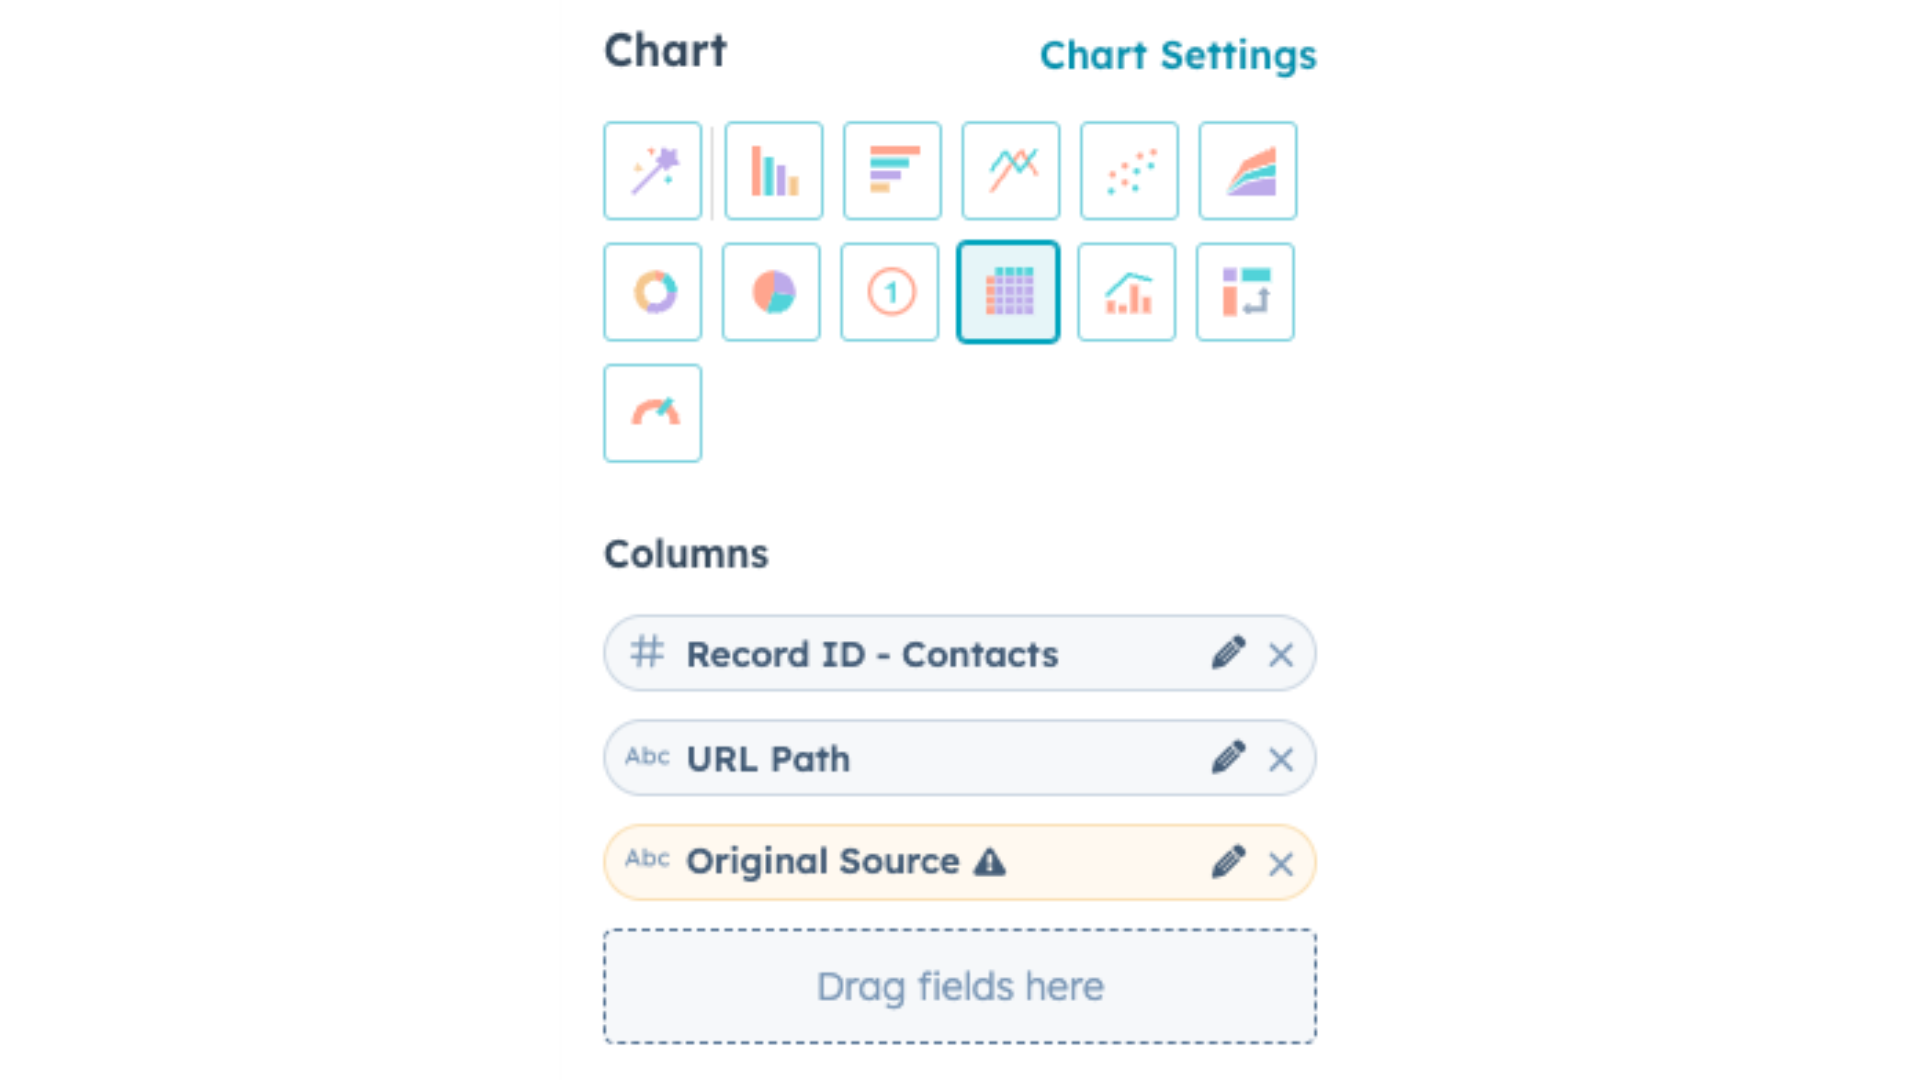
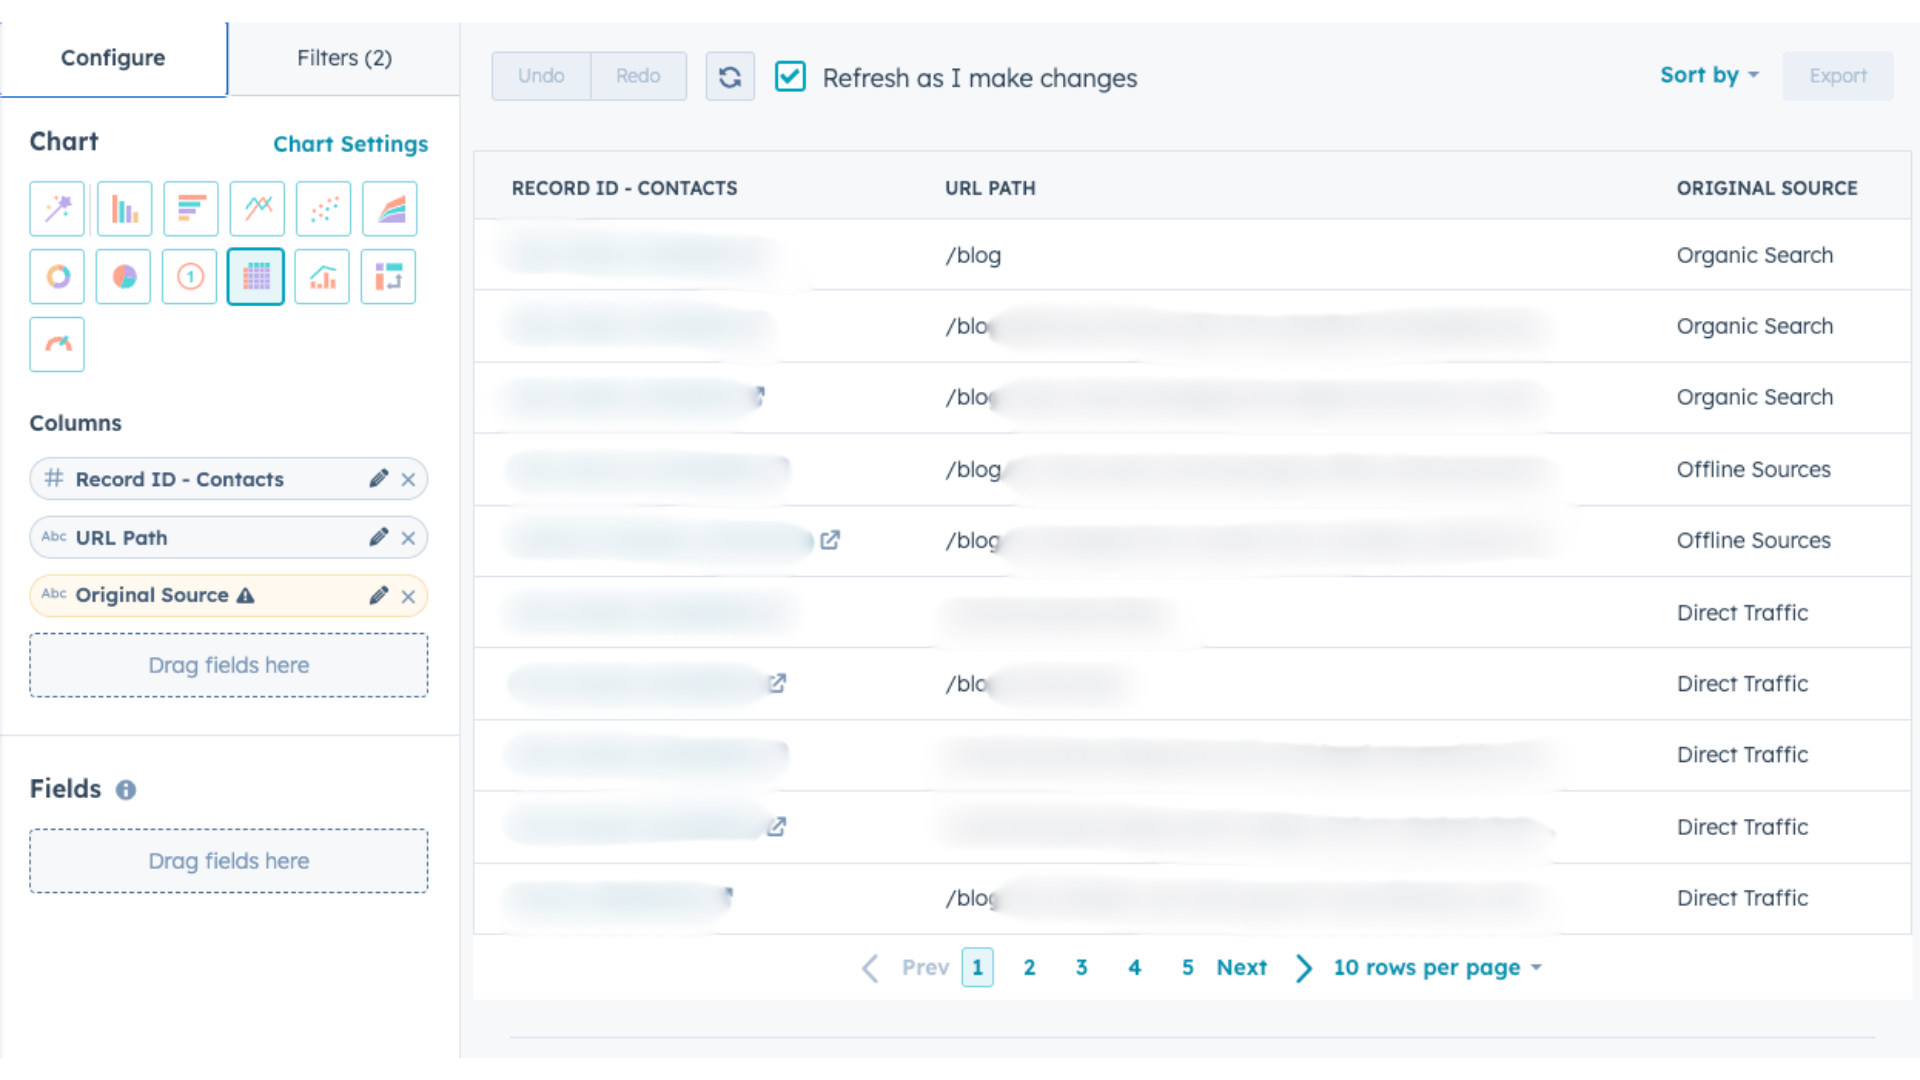
4. Select the table chart
5. Under columns, you want to add:
- Record ID - Contacts
- URL Path
- Original Source (if that’s of interest)
6. Head to filters
- Make the event timestamp the timeline you want to analyse (we usually pick last 30 days)
- Select filter “URL Path”, and click on “contains any” of “blog” (or your subfolder name)
7. Hit save. And on your right you’ll see a list of contacts which at any point in time went through your blog. If you’re looking to qualify, you can add a property like “Lifecycle stage” and filter for only “Opportunity” or only “MQL”. Take note of the influenced contacts and the pages they visited and then report on those too.
What does this report do?
It allows you to see which leads read your blog content and report on how your content is influencing a sale. It also allows you to direct your strategy: if you’re seeing a lot of leads read your blog content on “The future of AI”, it might mean that prospects are interested in reading more about this topic.
4. Report: Conversions per campaign
HubSpot is your CMS and CRM
One of our favourite ways to track results over time is to create a unique campaign that will only include the assets we produce (in our case, Bottom of the Funnel content).
That way, you can see at a glance how many new contacts that campaign has created. If you’re going to start creating content that focuses on lead generation, we would recommend setting up a separate campaign so you can quickly track its performance. Here’s how to do it:
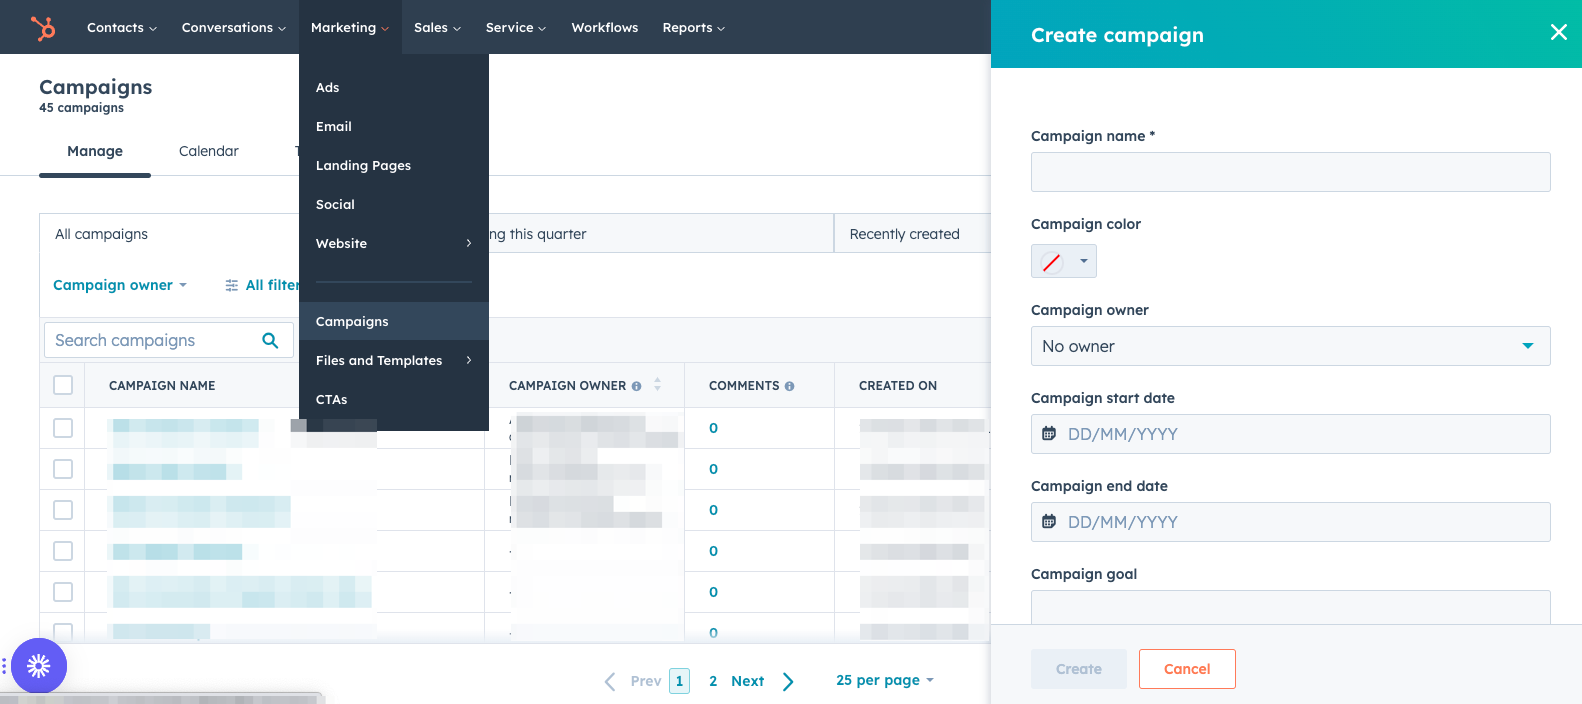
- Head to: Marketing > Campaigns.
- Create campaign > Start from scratch.
- Add details, and then ta-da, you have a campaign.
4. Then, whenever you create a new blog post, head to Settings of the blog post (Website > Blog > Create > Settings).
5. Scroll down, and you’ll see a “Campaign” box.
6. Click “Campaign” and then select your campaign.
7. Every time you publish, this blog will be connected to that specific campaign.
As you publish more content and contacts are influenced by your blogs, you’ll automatically see the numbers come up on your campaign dashboard.
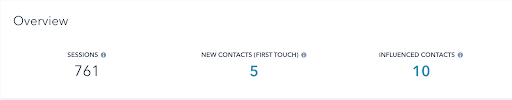
What’s so powerful here is that you can click through on the “New contacts” and “influenced contacts” and go through them one by one to see what kind of companies are reading your content.
If the salespeople are inputting financial information into HubSpot, you can also head to the Attribution tab, and then see which deals were created with your content, along with the interaction stage. If they add financial information, you can easily see how valuable each customer is, which makes it easier to then calculate the ROI of your content marketing efforts (this is where our screenshot above comes from).
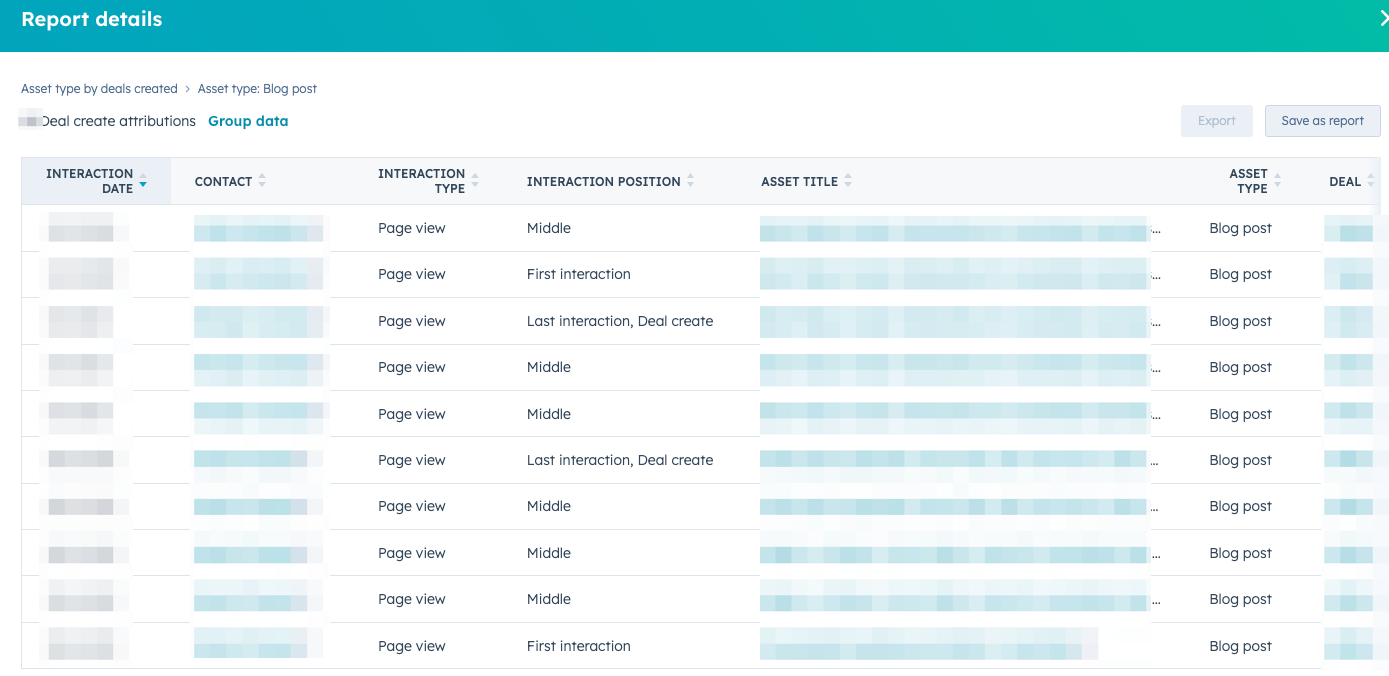
This is the type of information you can use in your own reporting to prove the business results of your work.
HubSpot is only your CRM
If HubSpot is not your CMS, you can track the results of your content via a campaign but it won’t be as accurate. That’s because you cannot allocate an asset to the campaign, and instead will need to create a unique campaign tracking URL which should then be used in every single blog post you publish.
The problem with this, is that you can’t add this URL to the blog itself. It has to be on a specific button (e.g. “sign up now” or “get in touch”). That means you’ll only be able to track those who click on that button, and not those who click away, read other articles, and then convert.
It’s not the most accurate, but still worth tracking.
To do this, simply:
- Head to: Marketing > Campaigns.
- Create campaign > Start from scratch.
- Once your campaign is complete, click on “Actions” drop down at the top right.
- Click “Create tracking URL”
- Build the URL. You can then use this to track who clicks on your CTAs on your blo posts.
What does the conversions per campaign report do?
Every month, you’ll see the new contacts generated from those articles in that campaign. You’ll also see the ones you influenced (and can therefore take partial credit for).
And if your salespeople are diligent with their updates, you’ll also see the size of the deals that are coming in from one campaign. This level of information will allow you to do qualitative research, and is hands down the best way to see if your content is bringing in high quality leads.
We like to set up a regular meeting with the sales team every month, and go through each contact one by one to ask about the quality of the lead. We also use this as an opportunity to understand what the contact’s pain points were, why they reached out to the company and how it’s currently going. This is next level customer research that is invaluable to creating a content and marketing strategy, and it’s all possible via a simple HubSpot report.
5. Report: Conversions per blog post
HubSpot is your CMS and CRM
This report allows you to view the number of conversions/leads/sales you’re getting per blog post in one glance. How to build it:
- Head to “Reports”, then “Analytics tools”.
- Click on “Traffic analytics”
- Click on the “Pages” tab.
- Change page types to Blog posts.
- Change date range to this month.
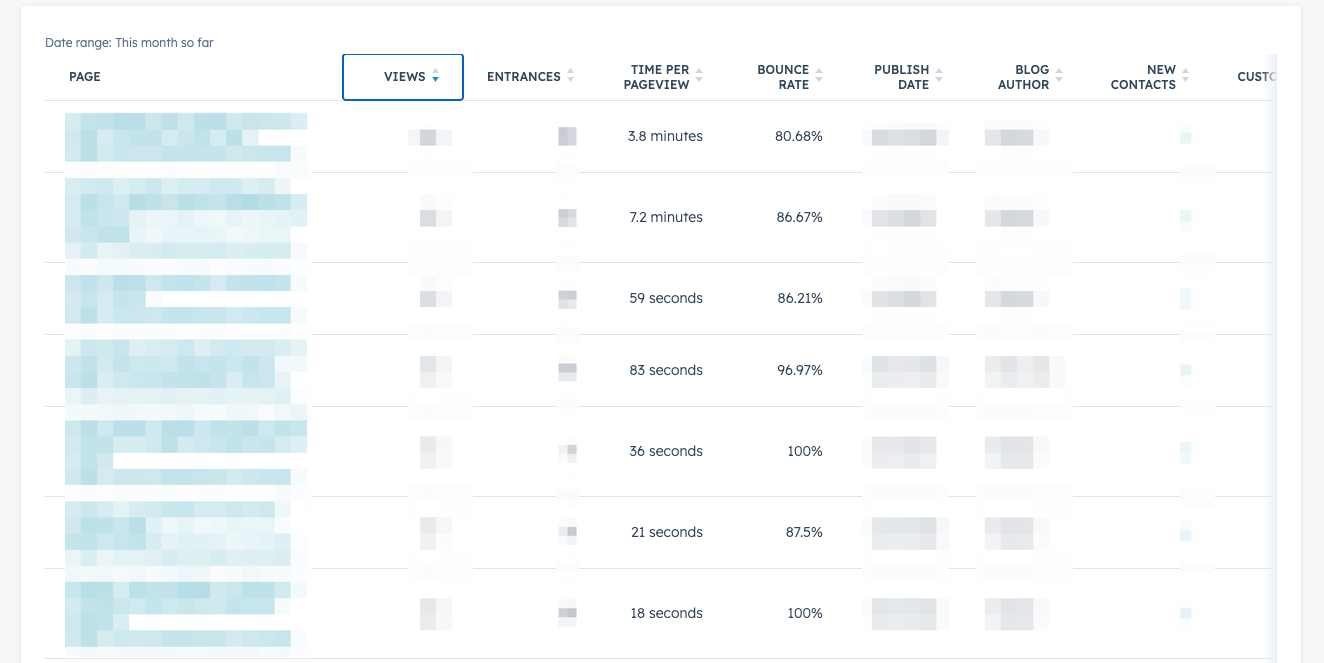
- Scroll down: that’s your report of new contacts (lead conversions) per blog post in the last month.
You can click on Edit columns and add more columns. For example, we like to add Submissions (for form submissions) and URL.
You can then add this report to your own dashboard to save it. Go to the top right, then “Save report” and “Save table”.
We recommend setting up your own dashboard so you can easily add all these reports and see them at a glance. You won’t be able to add the campaign to it (previous report), but you should be able to with all the rest.
HubSpot is only your CRM
You can also get this report if HubSpot is not your CMS, but it’s a different set-up.
- Head to “Reports”, then “Analytics tools”.
- Click on “Traffic analytics”.
- Click on the “Pages” tab.
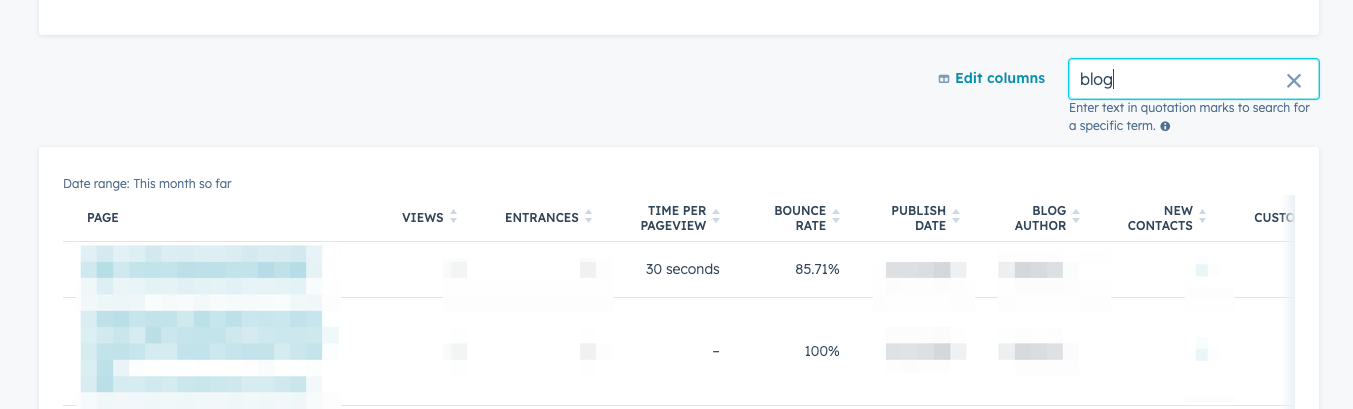
- You cannot change page types since you don’t use blog posts, so instead, scroll down to the table and put “blog” (or the blog slug you use) in the search bar.
- Change date range to this month.
- Scroll down: that’s your report.
You can then add this report to your dashboard to save it. Go to the top right, then “Save report” and “Save table”.
What does the conversions per blog post report do?
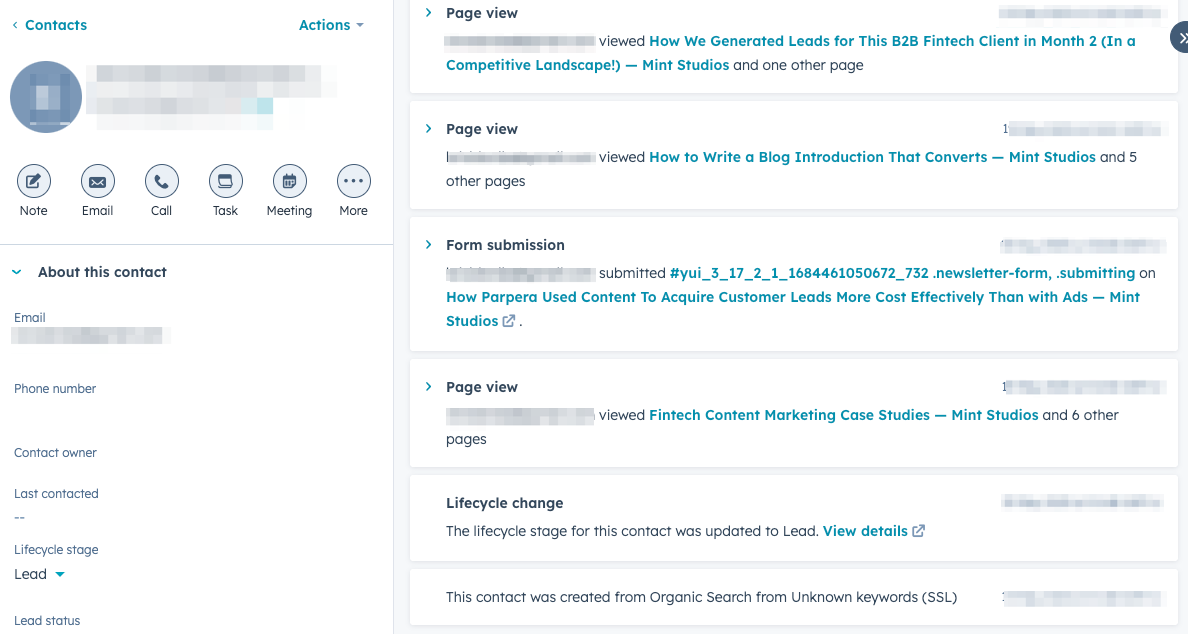
This is a great report to allow you to see a quick summary of blog conversions for that time period. Once again, you can also click through on the contacts and form submissions to learn more about the companies reading your content.
You can then look at their journey by reading through the contact’s activity: how did they discover your blog? What did they read afterwards? This is all crucial information to help with understanding your target audience.
6. Report: Contacts that viewed over 10 pages (for sales team)
This report might be more valuable for the sales team, but as a marketer you can use the report to help you understand which pieces of content are the most popular amongst your highest quality customers.
In the book They Ask You Answer, Marcus Sheridan talks about how his company figured out that the people who read over 30 pages on their website had a close rate of 80%, compared with 25% those who didn’t read any pages.
He was able to track all of this with HubSpot. And luckily, whether you use HubSpot as a CMS or not, this report is easy to set up.
It’s an excellent way for the sales team to identify warm leads, and for marketers to understand how readers interact with their website.
- Head to Reports > Create report.
- Scroll down to see the template called “Activity of recently created contacts”.
- Click on it, and on the filter on the right, click on “Add filter”.
- Click on the filter “number of pageviews”, and make it “is greater than or equal to” and put the number 10 (or 20, or 30, up to you).
- Click on Apply filter.
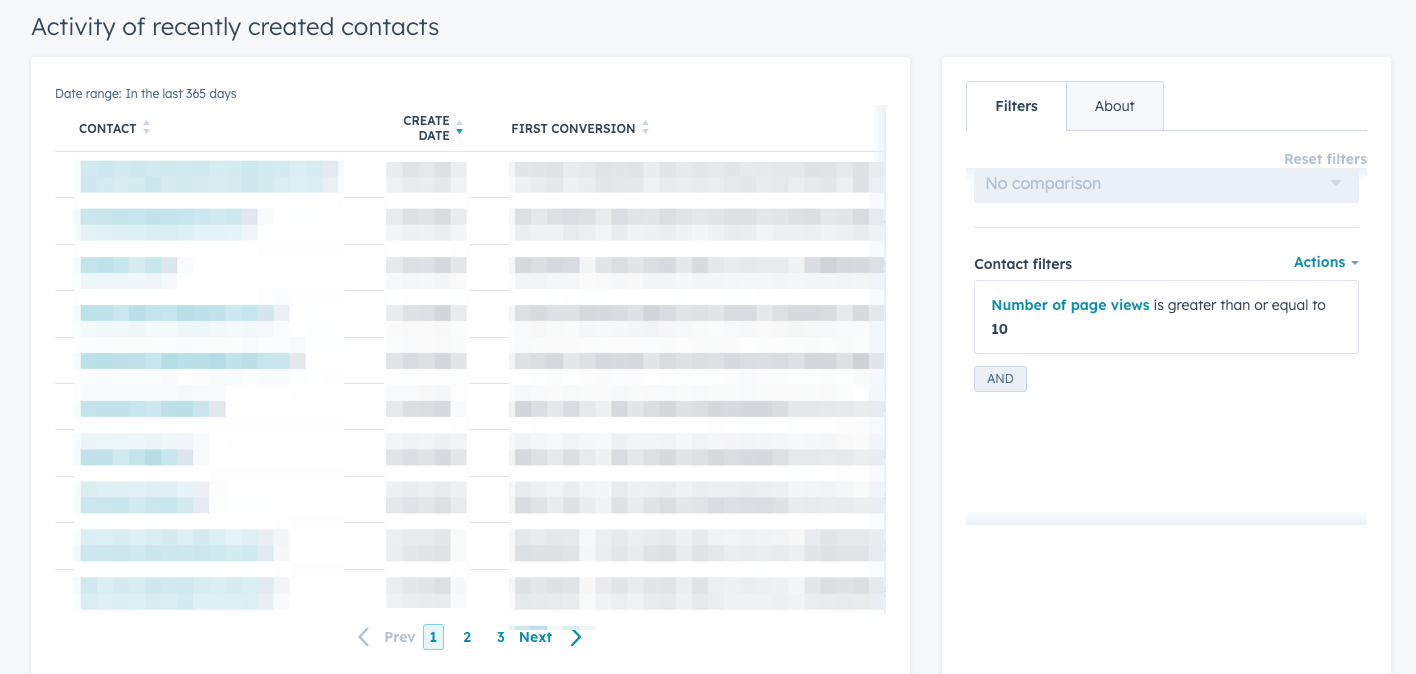
What does the “contacts that have viewed over 10 pages” report do?
It’s a very simple report, but it’s fascinating to track what people are reading on your website. You can also choose to filter for only blog posts: someone who reads over 10 blog posts on your website is clearly someone who’s interested.
This can be valuable information for the sales team, since it might indicate that it’s worth pursuing the contact if they’ve read over 10 pages of your blog. It’s also valuable for the marketer, who can use it to see trends and understand which pieces of content are making the largest impact.
One of the main complaints we hear a lot from internal content marketers at fintech companies is that content marketing is not taken seriously and is seen as a “nice to have”. But as content marketers, we have the power to play a huge part in the growth of the company. At our agency, we’re helping our clients acquire six figure deals that are instrumental in helping them with their next round of funding, generate revenue and build confidence in the marketing and sales team.
As a content marketer, you have the power to help the company grow as well. But to do that, you need the right tools and you have to be able to prove your contribution as well.
We hope this article is useful. If you have any questions, feel free to reach out to us.