
You’ve probably seen a decrease in website traffic.
You’re not alone. Multiple studies show that everyone is seeing a decrease in clicks. According to a study by Ahrefs, websites are seeing a 34.5% decrease in clicks to their website and another study by Kevin Indig corroborates this: fewer people are clicking through to websites.
The main culprit? AI Overviews (AIO). The short AI summary that you see at the top of the search results page when doing a Google search:
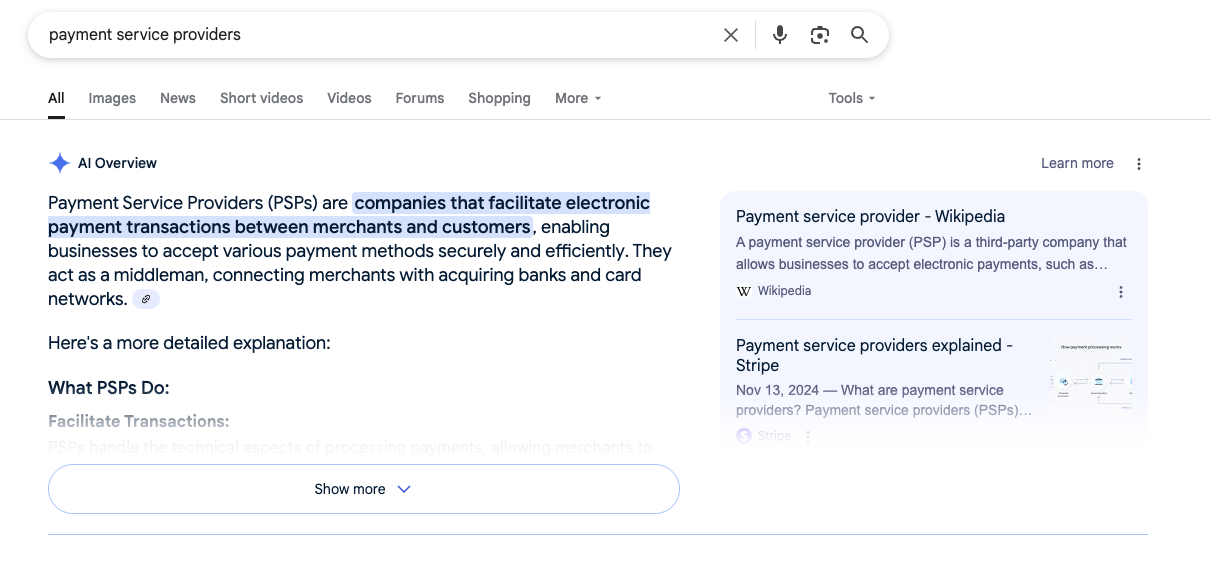
And it makes sense. For many queries like “what is a POS device?” an AI overview does the job quite well. If a user gets the answer from that overview, then they are a lot less likely to scroll down and click through links. So it makes sense that Kevin Indig’s study shows 7 in 10 searchers never read past the first third of an AIO – most people don’t scroll down.
But does that mean your content is making less of an impact?
No.
It just means you need to track the success of your content marketing in a way that makes sense in a changing SEO landscape.
In fact, traffic was never a great metric to track the success of content, because an increase in views doesn’t always translate to an increase in conversions. It’s a metric too far removed from a company's core business. The best example of this is HubSpot writing an article and ranking for “How to Type the Shrug Emoji ¯\_(ツ)_/¯” – is this really related to their business? Will more people reading this really help with company growth?
With AI Overviews, traffic is an even less reliable metric as fewer people click through to pages. So what’s the alternative? There are other ways to track the success of content, and one of the key ones is conversions (there are others which should also be tracked, and we dive into at the end).
If you are starting to see a decrease in traffic on your website and want to start tracking conversions, this article is for you. We’ll break down what type of conversions to track, as well as what your best options are to set up tracking.
We cover:
- Why conversion tracking is a powerful tool to measure content impact
- The types of conversions to track: first, last and multi-touch
- How to track conversions
- Why tracking conversions is just one part of the puzzle:
Note: want to get updates every time we publish a new piece of content? Join our fortnightly newsletter!
Why conversion tracking is a powerful tool to measure content impact
For a long time, the SEO industry and content industry used traffic as the main metric to measure whether content was working or not. The thesis went: by ranking for more keywords and increasing traffic, this helped increase brand awareness since more people were landing on your site.
We were never huge fans of traffic as the main metric to evaluate content effectiveness because it’s often a metric that is too separate from business metrics, as we’ve explained above.
Now, with AI overviews and LLM search, traffic is decreasing, and it is no longer a reliable indicator of success.
Enter conversions. When we talk about conversions, we’re mainly talking about high-intent “ready to buy” conversions. These are people who are submitting a form or booking a demo, and have expressed interest in buying. Although newsletter sign-ups and eBook downloads are interesting and should be tracked, form submissions with intent to buy are the most important ones.
What if you could see what pages those high-intent submissions read? And what if you could see what the high quality ones – the ones that turn into big deals – read on your website? That’s conversion tracking: connecting leads, opportunities and deals to the content they’ve read.
It’s a lot more aligned with the business, because you’re connecting the content you’ve produced to actual new prospects, new deals and therefore revenue. With this type of tracking, you can show that content marketing is helping bring in new revenue – which is exactly what it’s meant to do.
But how do you track these conversions, and what types of conversions should you track? That’s what we’ll dive into in this article.
The types of conversions to track: first, last and multi-touch
When we first started Mint Studios, our objective was to help fintech companies generate leads with content. We kept our conversion tracking simple: track and report on the number of leads that submitted a form after reading an article (e.g., contact us, book a demo).
If the fintech has installed HubSpot, we’d use this to also track:
- Lead quality
- How many leads turned into opportunities
- The number of closed won customers, along with the deal value
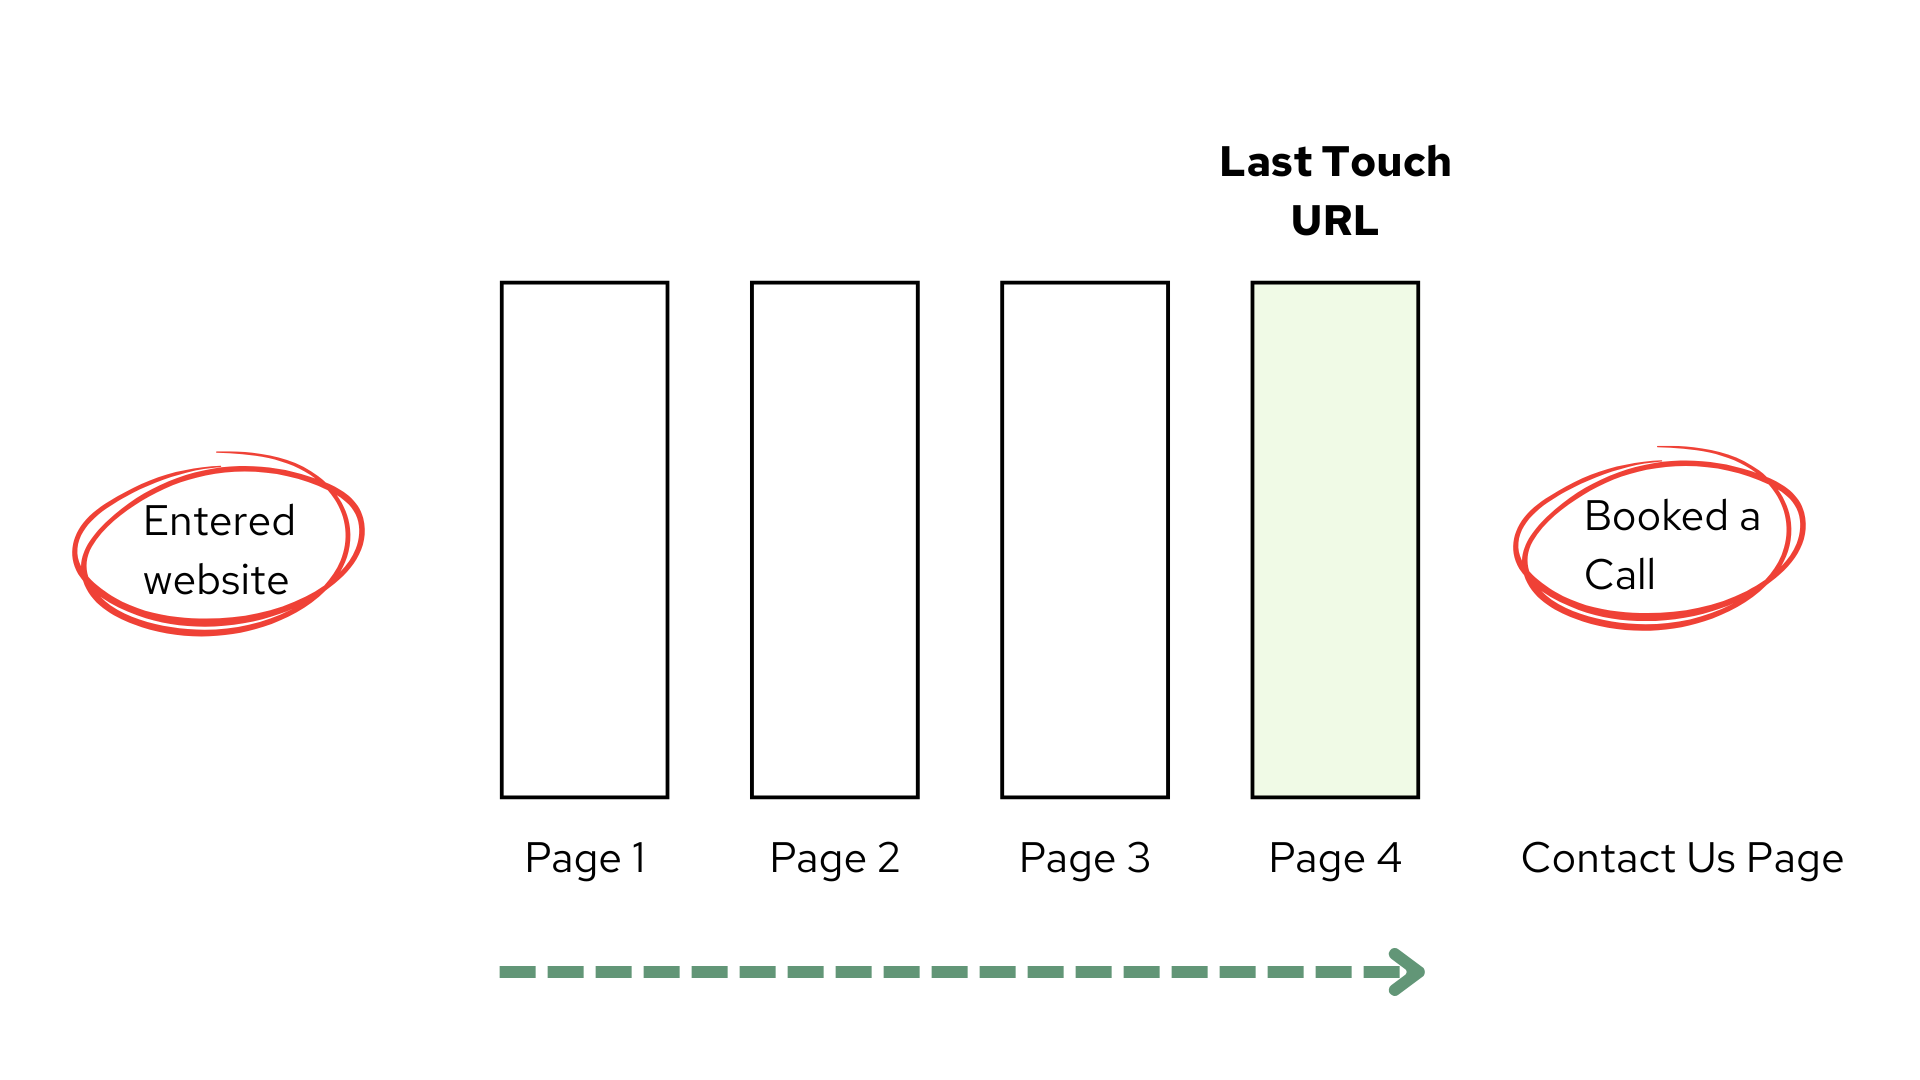
Up until now, we tracked these conversions based on when prospects interacted with our content, commonly known as first or last touch attribution. If you're new to first and last touch, here’s a simple way to explain it:
First touch URL: this is tracking the first landing page a user lands on when starting their customer journey.
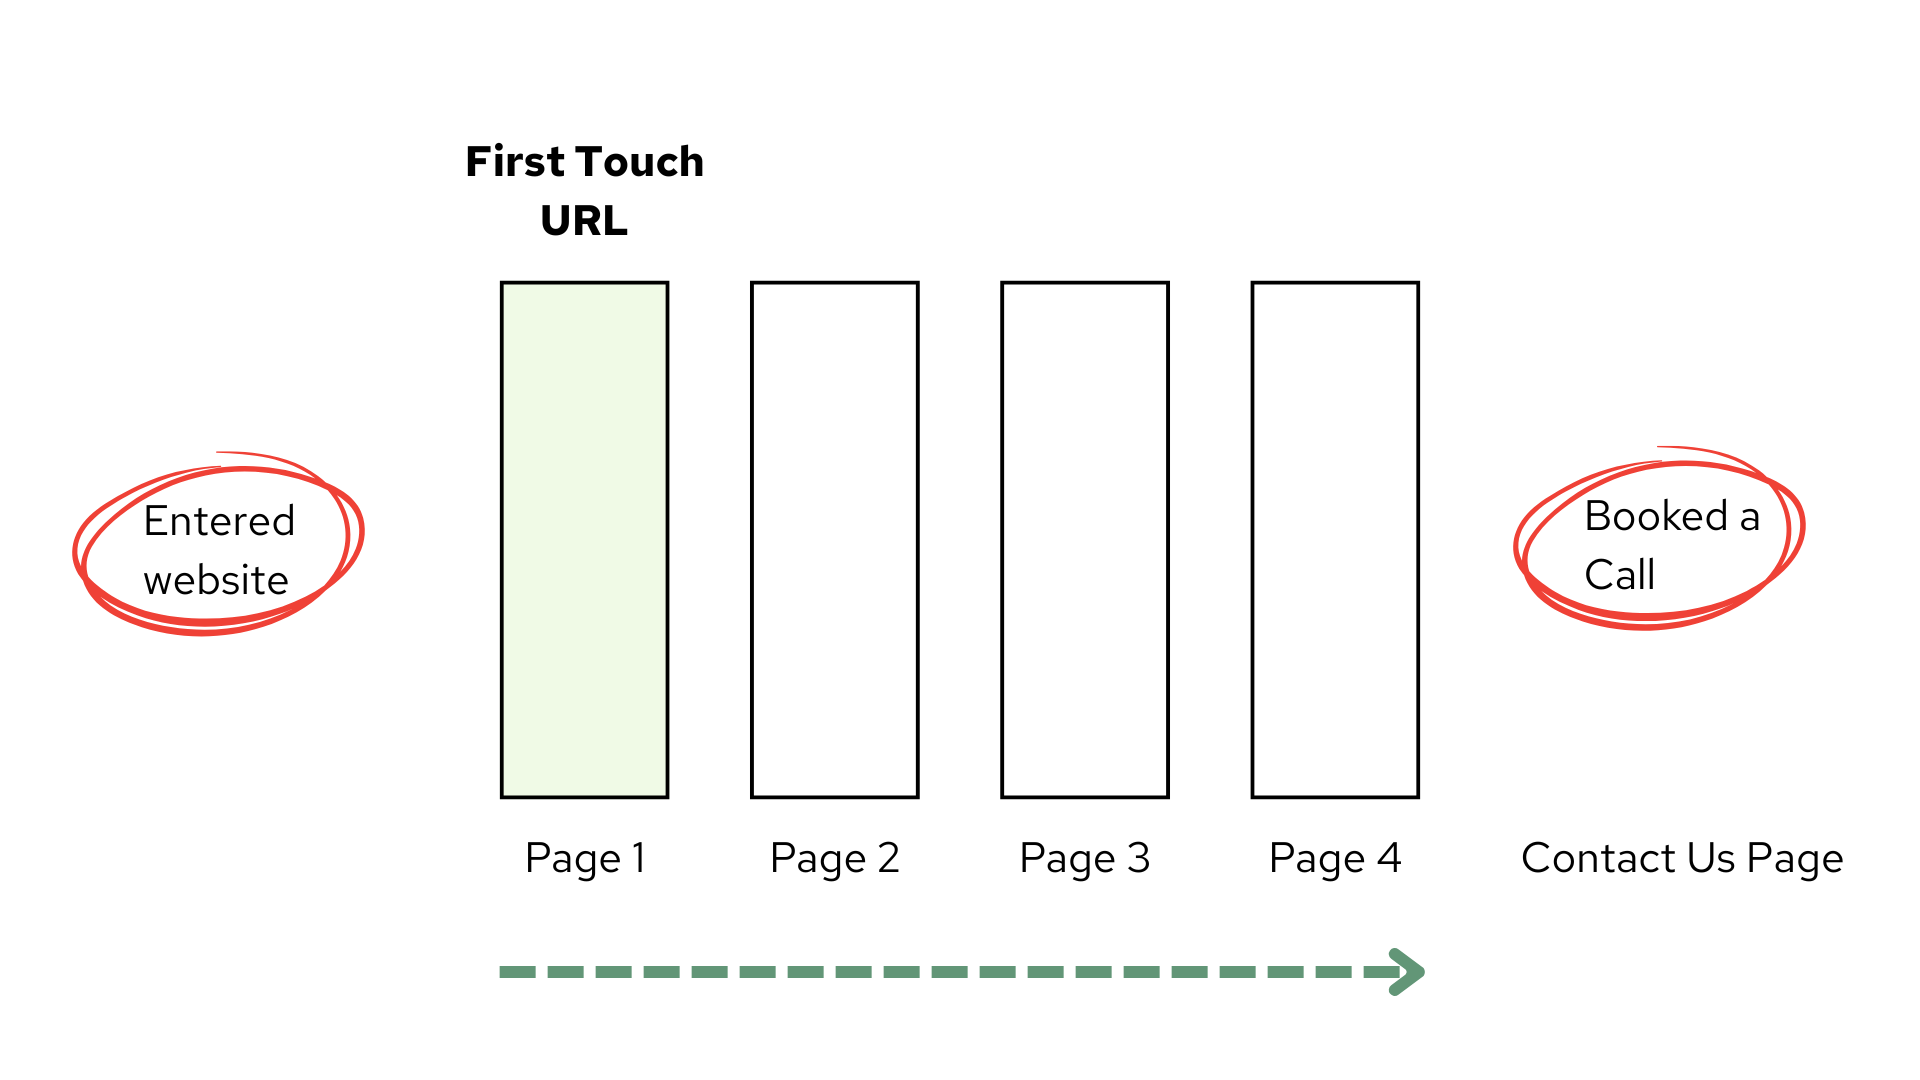
Last touch URL: this is tracking the last page someone visited before filling in a form submission
However, this type of tracking is no longer as useful and not the best way to track and report on content, for a few reasons.
Why first and last touch conversion tracking no longer works
1. Customer journeys are becoming more and more messy
From the early 2000s to around 2020, the customer journey was relatively linear: someone does research on Google, reads a blog, and then converts. This is because there weren’t as many options when researching and shopping online – most of the information a user was searching for was on Google.
But today, our lives have become more digital than ever. With more channels and ways to research than ever before, the number of touchpoints have increased. Now, a user will visit YouTube, check Instagram, read a Reddit post, scan a few product pages and blogs and then convert. According to research from Dreamdata, the average B2B customer journey has 62.4 touches across 3.6 channels and involves 6.3 interactions over 192 days!
That’s a very complex customer journey. And that’s why it’s very rare for someone to complete a form right after reading a blog, especially if it’s within the same session (described by Google Analytics as a 30 minute engagement period on a website).
It’s also inaccurate to track and measure the ROI of a specific channel. If a lead visited 3 different channels, which channel gets the credit?
These complex non-linear customer journeys are making ROI measuring ineffective. A better approach is to track all the touchpoints a user goes through. We go into more detail about how to approach this below.
2. More people do their research on LLMs
For a long time, SEO was the best distribution channel. No other channel allowed you to target and reach your prospects right at the point of purchase, such as when they’re comparing various tools or looking for a solution to a specific use case.
But buyer behavior is changing as AI-powered tools become more accessible-and not just through Google's AIOs. More and more people are going straight to their favorite large language model (LLM), like ChatGPT or Perplexity, to do their research. Instead of clicking through 10 blue links on a traditional search engine page, they get all the information they need on one page directly without having to wade through any ads. Once they’ve done that research, only then do they click through to the website to book a call or make a purchase.
Currently, LLM searches make up a small fraction of all online searches. But, considering the rapid growth and accessibility of free LLMs, this trend is likely to increase. LLMs may not completely overtake Google, but they will definitely fragment the search landscape to a point where diversifying your conversion tracking is key.
In other words, people using LLMs to do research are making the buying process even more messy. As more people rely on LLMs for their research, fewer will read an original piece of content directly, preferring to learn through AI-generated responses, with no brand names attached. This makes attribution even harder since LLMs commoditize content and only added sources in certain types of searches.
So, what can we do?
It’s important to adapt. First and last touch attributions no longer reflect how people buy. Content is still key to growing a fintech company – arguably more than ever, because without quality content, LLMs won't crawl your website or appear in their search responses.
However, it’s still important to track and report on the success of your content marketing, especially to prove to leadership how it helps grow the business. A key way to reframe this is: instead of content and SEO “generating a lead”, see them as one of the many touchpoints that help acquire a customer.
This is where “multi-touch” attribution comes in: a model that tracks as many touchpoints as possible and views content more as “influencing” (which in actuality, all marketing does) rather than “generating” leads.
Using the same diagram as before, we’d visualize it as:
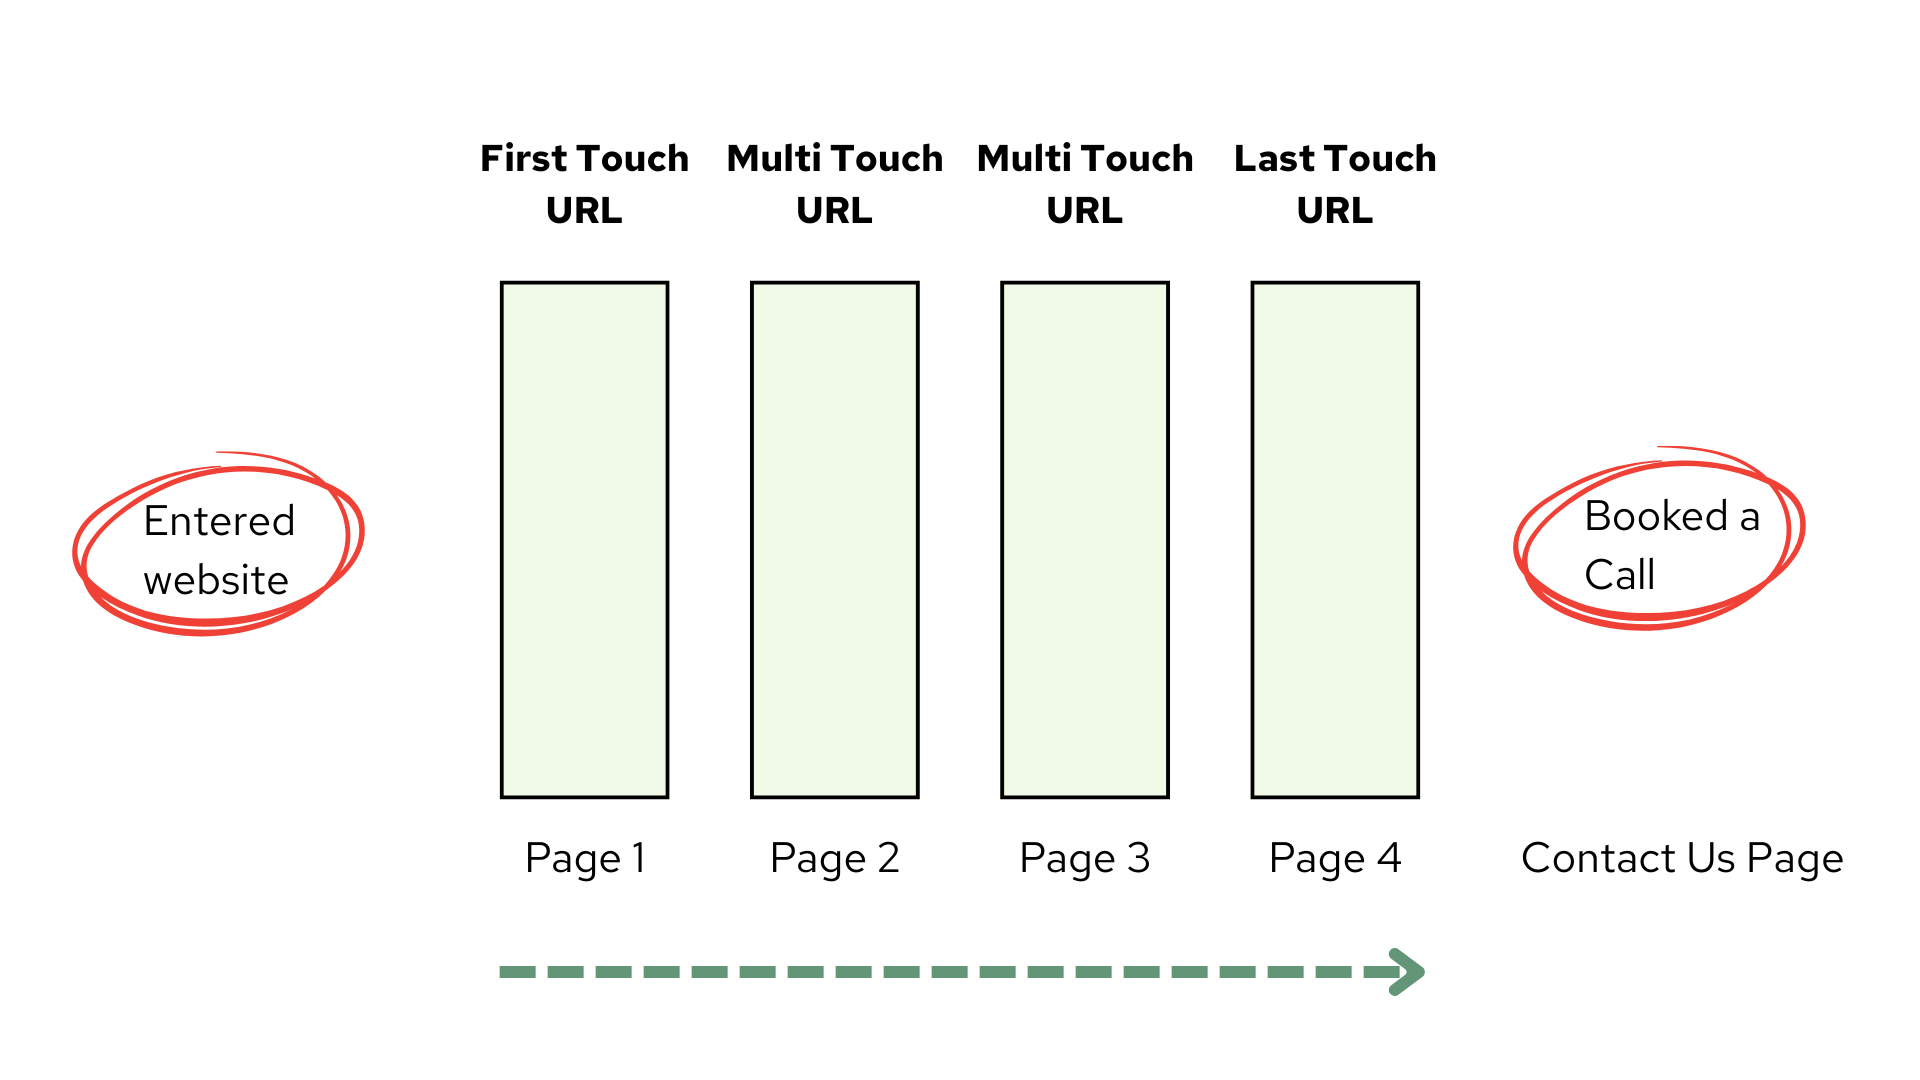
In this scenario, we track every URL that a user visits. If any of those pages are a piece of content, we then track and mark it as “content contributed to generating this lead / opportunity / deal”.
Multi-touch attribution is a more accurate way to track content's contribution to growth, because it represents the complexity of how customers now consume content.
In the rest of the article, we’ll break down exactly how to track and report on first and last touch (they’re still interesting to track), and most importantly, multi-touch attribution, to show how content is contributing to growth.
How to track multi-touch conversions
There are three main ways to track conversions:
- Via your CRM
- Via a third party tool
- Via GA4
1. Via your CRM
1. HubSpot
HubSpot is the best CRM tool for marketers tracking the results of content, hands down. You can see the full journey of each user, and you can create detailed reports that allow you to see the total revenue your content has generated. It’s a content marketer’s dream.
If you have HubSpot, tracking conversions is easy and most of the hard work is done for you. With HubSpot, you can see:
- Deal revenue per piece of content
- Influenced contacts per blog
- Conversions per blog post
- Contacts that viewed over 10 pages
As an example below, with this report you can see at a glance which pages contacts are viewing on your site. You can filter for only Opportunities or Closed Won customers, allowing you to see all the pages a contact visited that led to them eventually converting.

Since we’ve done so much work in HubSpot, we’ve written an entire guide on how to set up your content tracking and attribution reports in the following article: How to Track the Quality of the Leads Your Content Brings in [With 6 HubSpot Reports]
To quickly summarize: to track first / last touch, filter your report for “first page seen” and “last page seen”.
For multi-touch, it’s a little more complicated as you’ll need to use HubSpot's Custom Report Builder and add a filter where “URL Path” contains “blog” (or any subfolder where your content sits). The link above includes a step by step guide on how to set this up.
With HubSpot or third party tool, you can also track:
- Which submission form did they use?
- How many became SQLs / qualified leads?
- How many deals were created? What was their value?
- What channels did they come through? E.g. organic, ChatGPT, etc.
And the key thing is to track this over time. If you can, you also want to track the revenue each attributed conversion brings in, as well as the number of converted leads.
2. Salesforce, or any other CRM
If you have Salesforce or any other CRM, the tracking gets a bit more complicated. While these platforms collect comprehensive data, they make it very hard to create the reports you need in a presentable and easy to read format.
The way Salesforce presents data is that they look at the overall channel. So you can see how many leads, MQLs and opportunities are coming via “organic”, but this includes branded searches. This means anyone typing in your brand name is marked as organic, even though they clearly already knew about your brand.
The only way to filter out “non-branded” searches is to view only leads that came through pages that are not the homepage, but this is not a filter Salesforce lets you set up. You can also see this if you manually check the journey of each lead, which is of course very manual and time-consuming.
To get the information you need, you can hire a consultant to set up a custom report for you, but it’s expensive and you often won’t get the data you need.
Which is why, in general, your next best option here is to explore third party tools…
2. Via a third party tool
If you use Salesforce or another CRM, your best option is to use a third party tool to get the information you need. The downside here is that the tools can be expensive, so you really need to have a good use case to show leadership that they are worth investing in. These are the tools we’ve seen work so far (and we’re always open to considering and testing others):
- FormulaYT ($600 / month): this form tracking tool monitors the URLs that your user visits before and after converting on that form. It’s great to track first and last touch conversions, but you’ll still need another tool or set-up to track multi-touch. You’ll also have to redo all your forms so they are within the tool which can be time-consuming.
- DreamData ($800 / month): large enterprise tool for tracking the whole customer journey. It’s a fantastic tool to see how your overall marketing channels and touchpoints influence prospects and customers. The downside is its price.
- HockeyStack ($1,200 / month): another enterprise tool that allows you to track and report on many different touchpoints a user goes through. It’s also a fantastic way to view the whole journey, but also a more expensive option.
- WhatConverts ($150 / month): this tracks and shares the URL of every page a lead visits when converting. You simply tell the tool which forms you want to track, and it’ll show you each lead's conversion path on your website. This means you can track first, last and multi-touch attribution. For our clients that have Salesforce and can’t use GA4, we use this tool. The main downside is that they don’t have filters that make it easy to report on multi-touch – but you can find the information you need manually.
What’s good about these tools is that they’ll often not use classic marketing cookies, which means they can get more information than Google Analytics. You also have more ways to slice and dice the data. For example, WhatConverts allows you to track calls and mark the quality of leads, and DreamData lets you see the breakdown across all channels.
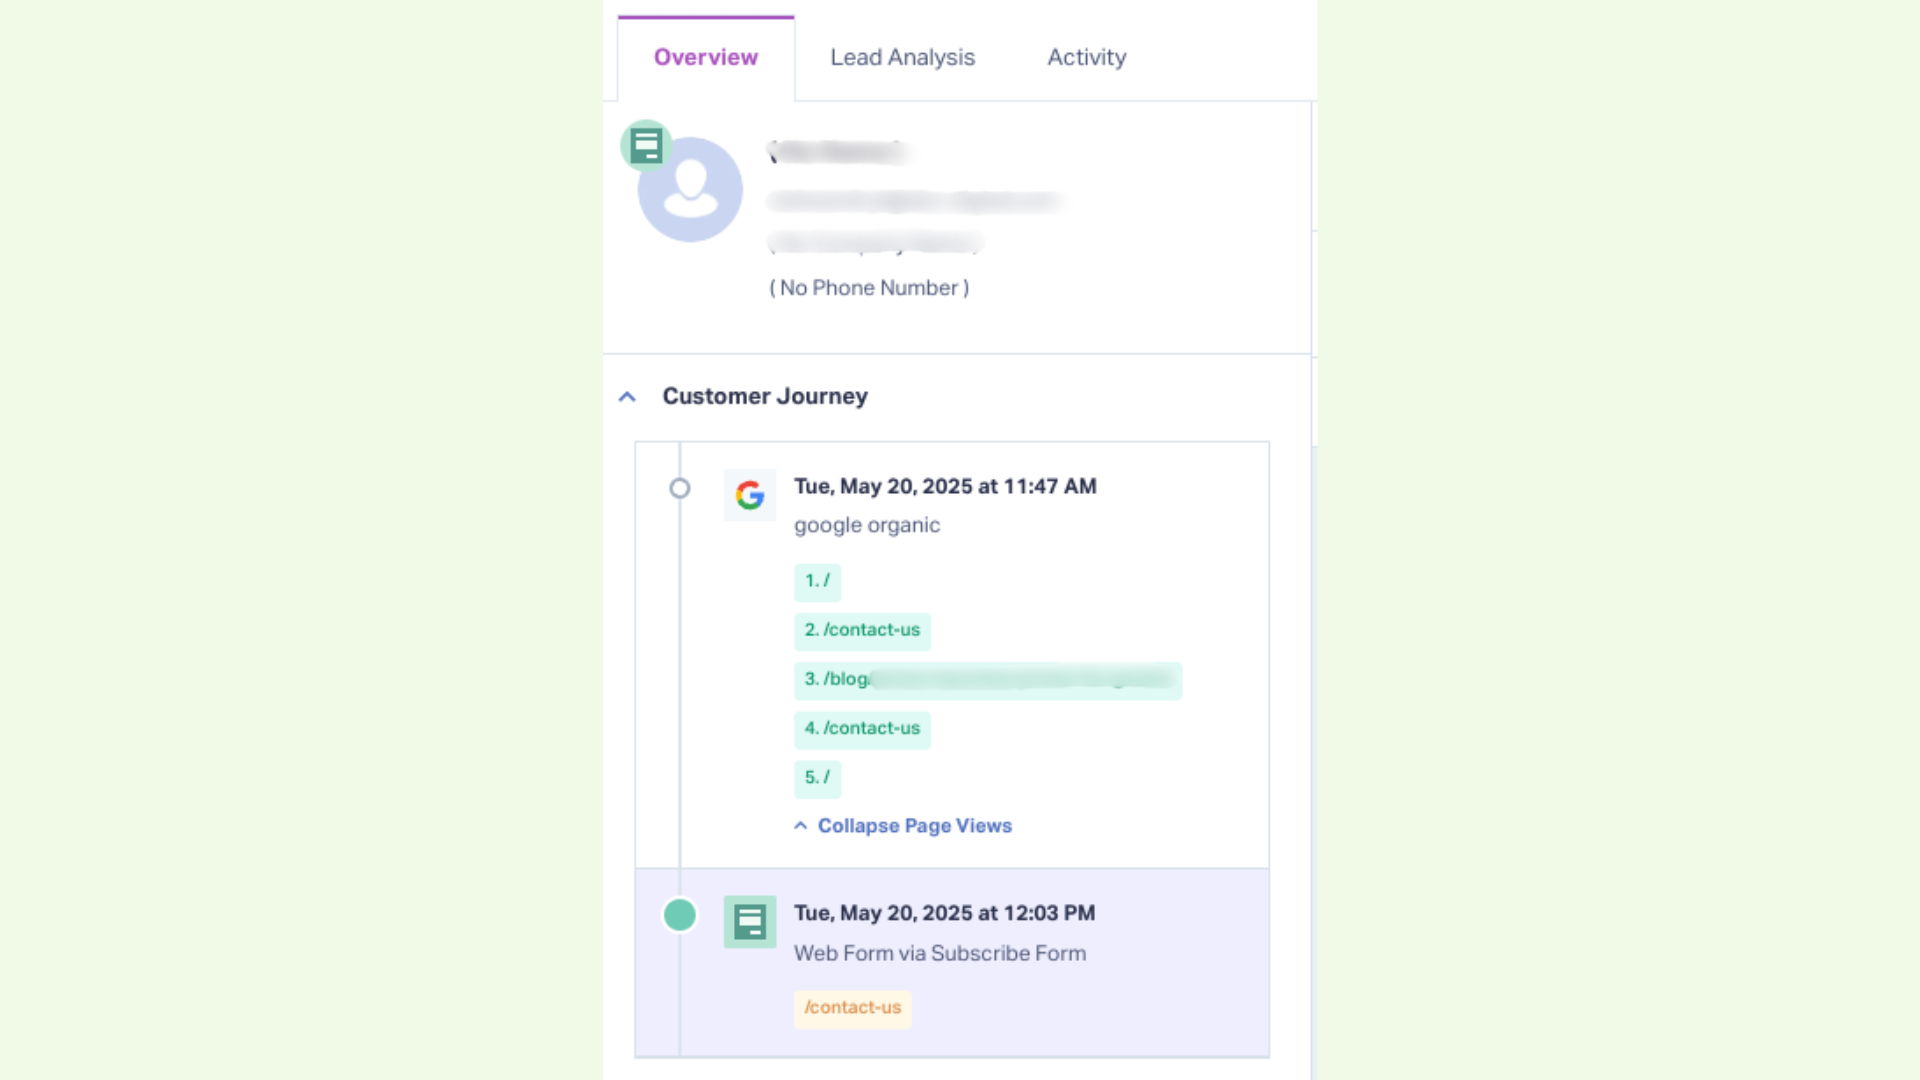
We use WhatConverts, as it allows us to see the full journey of a prospect and filter for those that have visited content at one point in their journey:
3. Via GA4
If you’re not using HubSpot, and for some reason you can’t use a third party tool, your next option is GA4. It can also be good to have GA4 tracking in place as well as a third party tool to compare notes.
There are a few downsides to using GA4 though:
- You only get total numbers, not the quality. You’ll see which blogs or pages are bringing in conversions, but you won’t be able to see the name of the companies, whether they are qualified and the amount of revenue generated through a deal. This may be fine for small or medium-sized SaaS firms, but for enterprise-level B2B it’s a big deal as one high quality lead is worth a lot more than 10 low quality leads.
- With consent mode and cookies, it’s harder than ever to track this. Unless you’re bringing in tens of thousands of sessions per month, consent mode typically decreases the amount of data you receive. You won't be able to track anyone who doesn’t accept cookies. This makes it hard to get an accurate picture of the impact of your content.
Having said that, using and tracking GA4 data is better than no tracking at all.
The unfortunate thing, however, is that GA4 does not make it easy to access this information. This was possible with Universal Analytics, the old version of Google Analytics, but not with GA4. With the GA4 UI, you’ll only be able to see:
- Number of users which completed an event (and which URL they previously were on) in one session (essentially first touch within one session) – which few people do, especially in B2B.
- All users who visited a blog page and completed an event at one point in time – but you can’t see a breakdown per page
- Which pages people visited before completing an event. This is the most accurate, but requires clicking through every session via a funnel diagram, which you can't export– it’s very manual and not the right approach because you can’t share the data.
The best approach is via BigQuery, which is Google’s data warehouse. BigQuery allows you to access the raw data of Google Analytics, and therefore the full journey a website user goes through before submitting a form. However, to use it properly you need to be familiar with SQL data analysis to access the information you need and build your own interface via a Looker Studio report.
If you have the expertise in-house such as a data scientist or an experienced marketing ops person, then maybe they can build this for you. It will require:
- Getting a BigQuery project with the right authorizations
- Someone with expertise in SQL queries and formatting the data
Duplicating a Looker Studio report is not enough, the person needs to build the tables themselves.
We have expertise on our team, and for every client necessary we build this. Our report looks something like the one below, and allows us to answer the question: how many booked calls or form submissions happened where the lead at one point in their journey visited a content page?
You can see what the report looks like here:
And this gives us the information we need: is content marketing working? In other words, is content influencing prospects and helping grow your company?
If you’d love to set up a dashboard like this, we can help build it for you. Reach out to us to get started.
Tracking conversions is just one part of the puzzle
Depending on your setup, hopefully you’ve found a way to track conversions from your content.
But it is important to remember that conversions are just one part of the puzzle. The impact of content can be huge: it helps with building trust, speeding up sales and increasing brand awareness.
And as more people consume content via LLMs, many prospects will read your content straight from ChatGPT, then head to your homepage to convert, skipping any blog content or reports. Although that prospects will be marked as “Direct”, it was thanks to content that the brand appeared on AI search. This is why conversions and tracking URLs visited is just one piece of the puzzle, and you should track other metrics as well.
It’s also why it’s better to move away from a mentality of “what is the ROI of content”, and more towards “how do we know content is working?”.
This is true not just for content marketing, but for many other marketing activities, where it’s getting harder and harder to attribute conversions to a specific channel or type of marketing. And it will only get harder.
What are some other metrics that you can track to prove that content is working? Truth be told, there are quite a few others, and the right ones will depend on your product, business strategy, and how your target customers buy from you. Examples of other metrics are:
- LLM visibility: how many prospects self-attribute as coming from LLMs? (it’s likely they found your brand because LLMs crawled your content)
- Sales velocity: do prospects that read your content lead to faster closed deals?
- Brand awareness: do prospects mention your content in calls?
- Brand awareness: is your brand appearing in LLMs for the right topics?
There may be others that are worth tracking, such as appearing on AI overviews, or mentions in third party publications. The key thing is that they are metrics that are truly tied to growth (we'd argue time on page, for example, isn’t a relevant metric).
As an agency, we’re exploring other metrics to track the success of content, namely those that are more closely tied to helping the sales team, which we’ll go into detail in another article. But for now, multi-touch is a good place to start as it’s a lot more aligned with how buyers interact with content and how content can help your company grow.
If you’re looking to invest in content in a way that helps contribute to growth – and in a way that you can prove – we may be able to help. Reach out below to learn more about how we can help you: