

You’d like to start investing more in content — but before doing so, you need to make a case to the higher ups and the team.
That means it’s time to get serious about content attribution and calculate how many customers you’re currently getting from your content marketing efforts.
It’s not easy, so the big disclaimer is: it’s not a perfect science. But we still believe it’s important to measure as much as possible. As the saying goes, what can be measured, can be managed.
The main value proposition of working with Mint Studios is that we don’t just help fintech companies with traffic: we help with lead generation as well. That means we create content that is focused on conversions, and tracking it means we can calculate the number of customers we’re generating through our efforts.
How do we do it? We’ll outline it step by step in this article:
- Tracking conversions
- Breaking down conversions per page
- Calculating the number of leads you need to break even
Note: are you a fintech company looking for support with content marketing? Learn how we help fintech companies grow customer acquisition by over 700% with our agency: the Mint Studios Method
But first: what does a conversion mean for a fintech company?
A conversion might mean different things for different businesses. It could be a newsletter subscriber, a form filled in, a waiting list sign up or an app download.
Based on our work with fintech companies, conversions are usually the following:
- An app download
- A form submission
- An account created
- A waiting list joined
Before measuring conversions, it’s important to define what a conversion is for your company. You can also have several conversions — e.g. you’re tracking form submissions and newsletter sign ups.
Once you’ve determined what a conversion is, here’s how to attribute your leads/conversions to content marketing:
Step 1: Track conversions
There are a few ways to measure the number of customers you get, and it depends a little on the tools you are using. If you use Hubspot, then attribution and tracking is built into the tool and you’ll have great visibility on what’s going on in the website. But if you don’t, then you’ll have to resort to Google Analytics or another similar tool such as Databox.
Most people use and are familiar with Google Analytics, so the steps below are to measure conversions with GA3 (GA4 will be the default browser from July 2023, so it’s worth getting familiar with that as well):
1. With a thank you page
This type of conversion tracking is not the most common for fintech companies, since fintech customers are usually downloading an app or submitting a form to learn more.
But if you’re signing people up for a waiting list or a newsletter sign up, then this is the easiest way to track conversions.
At Mint Studios, we use this tracking method to track newsletter sign ups. If you sign up to the newsletter, you’ll be taken to a separate thank you page once you sign up.
This is pretty easy to set up on Google Analytics. On your GA account, head to Admin > Goals > New Goal. Then create a new goal: make it Custom, give it a name, select “Destination” and put the URL (commonly /thank-you) into the form input.
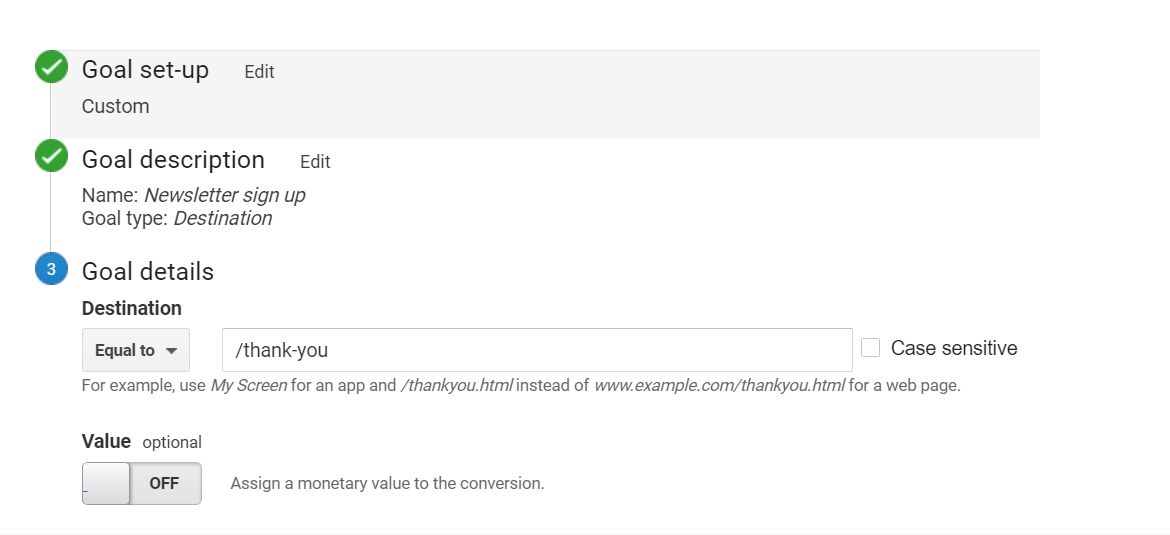
Of course, you need to have a separate thank you page to have that set up. If you can’t do that yourself, ask your developer to set up a thank you page where users will land once they convert.
Every time someone lands on the thank you page, they’ll have converted – whether it’s a waiting list, newsletter, etc. You can test if it’s working by heading to the “Real-time” section of Google Analytics, doing the conversion yourself and hopefully it should turn up.
Some tips for the thank you page:
- Don’t just have a blank page with “Thank you”. Someone who converted is someone who is highly interested in your product or service, so use this as an opportunity to encourage them to keep browsing your website
- Add your top case studies, or a big button that says “Check out our blog”
- Add testimonials and information
2. With events via Google Tag Manager
What if you can’t set up a thank you page? Or you’re tracking something else, like forms, app downloads or accounts created?
That’s when you turn to Google Tag Manager. GTM is a free tool by Google that essentially helps you set up specific triggers and events to track how people are interacting with your website.
At first, Tag Manager is complicated and strange, but once you get the hang of it, it’s a great tool that helps you navigate and understand how people are interacting with your website. If you want to learn how to use GTM properly, we highly recommend Julius’ Tag Manager course (you’ll get 10% off with this link).
Form submissions
We don’t want this to be an in-depth walkthrough of how to set up GTM, because we know someone who explains it a lot better than we do. This article by Analytics Mania provides a great walkthrough of how to do form tracking:
- With GA4: Google Tag Manager Form Tracking with GA4: 7 Ways To Reach Your Goal
- With GA3 (UA): Track Form with Universal Analytics (GA3) and Google Tag Manager
But essentially, you first need to test and see if Tag Manager’s built-in form tracker detects the conversion happening on your website. If it does, then you can set up a trigger and tag for that specific event.
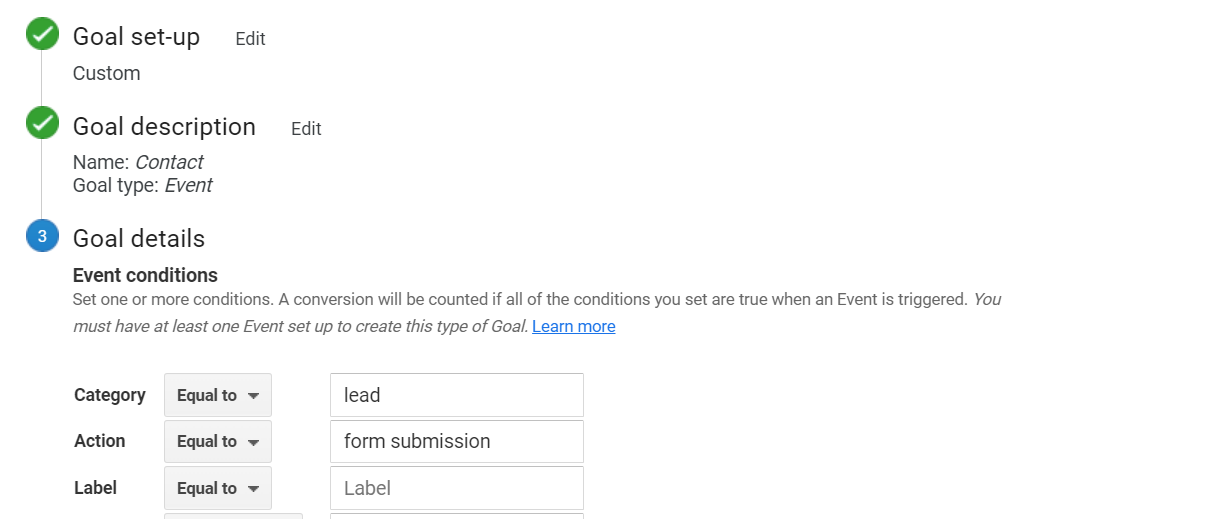
(this is the Goal set up when someone submits the Contact form on our website)
Once you’ve set up a trigger and tag, it’ll come up as an event on Google Analytics. You’ll then need to create a separate goal and you’ll be able to track it from there.
And on the topic of GA4: we still recommend having both UA and GA4 set up. GA4 is still changing and adjusting, so it’s best to have both (but start familiarising yourself with GA4).
App downloads, and other actions
App downloads are notoriously hard to track. Really, you need your product team and dev team to set up a custom set up in order to track this, or a really great product management tool.
So what do we do when this is not the case: track specific clicks.
Yes, it’s not the best, but once again it’s better than nothing. Although it might not tell us how many leads/customers we are getting, it will tell us which blog articles are generating the most buying interest.
Once again, here’s Julius’ walkthrough on how to track clicks: Google Tag Manager Click Tracking: All You Need to Know.
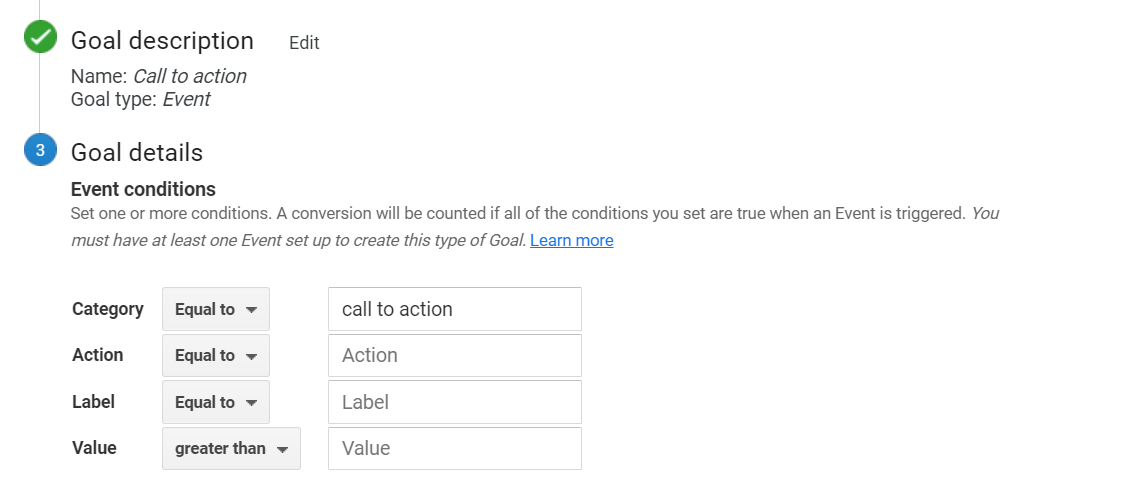
As you’ll see, the key here is to find out what is unique about the link or button you want to track, and then set up a trigger and tag that only fires when someone clicks on your link or button. It’ll then come up as an event on Google Analytics, and you create a Goal to track that event.
Account created
Once great thing about GTM and GA, is that you can track every step of the account creation process and see where people drop off.
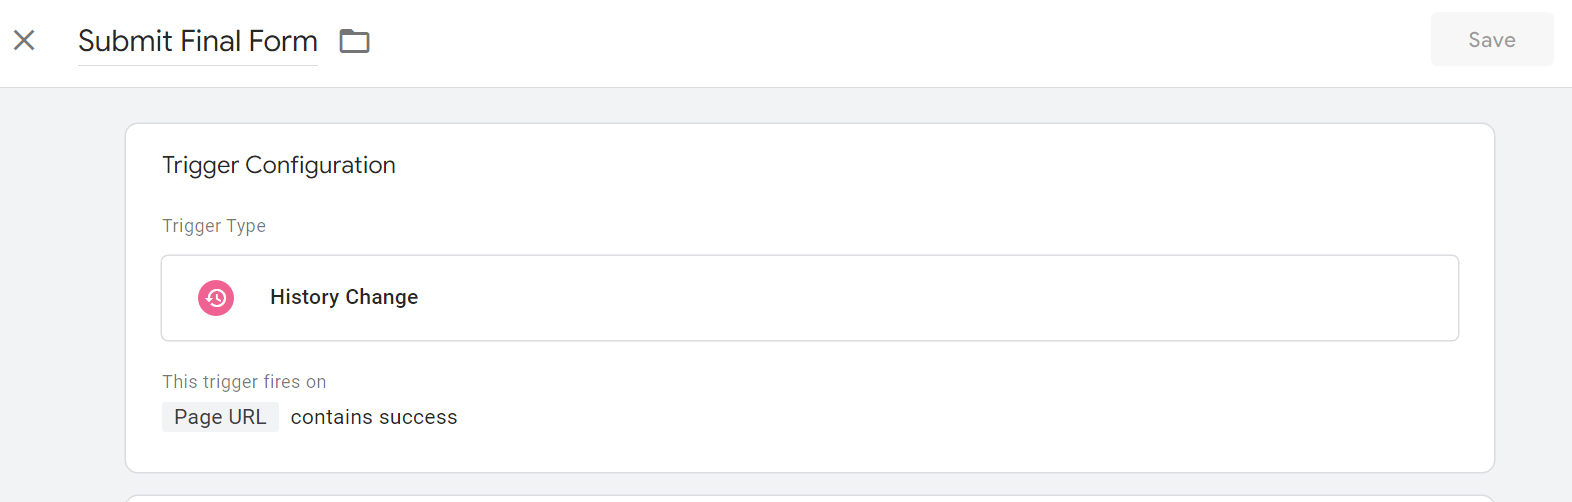
There are several ways to do this via Tag Manager and Google Analytics. We usually like to use “History change” on Tag Manager, as the URL changes with each step. For example, when the final URL includes the word “success” that means the user has completed the sign up.
It was hard to find a video or article that walks you through how to do this, so if this is the set up you have and you’re stuck, feel free to email us through the website and we’ll do our best to show you how to do it.
Step 2: Break down conversions per page
The reason all this tracking is useful is because it’ll tell you which blog posts and pages are generating the most conversions. When you’ve set it all up, you’ll see first hand how articles with high traffic won’t always equal articles with the highest conversions.
There are a few ways to view the breakdown of conversions per blog article, but the most accurate one is the Model Comparison Tool. Head to Google Analytics, then, on the left click on Conversions > Multi-channel funnels > Model Comparison Tool. Set the lookback window to 90 days and put First interaction and Last interaction. Then set the dimension to “Landing page”. If you’ve had your conversions set up for a while, you’ll see the conversions broken down by page URL.
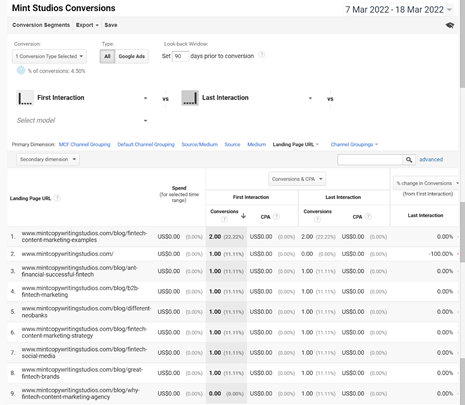
The Model Comparison Tool is more accurate than just checking the Goals or Events section, because it’ll give you the difference between First and Last Click conversions. And that’s important.
What is Last click interaction? That’s when the reader converts in the same session as when they landed on the page.
The problem with this type of tracking is that most people don’t convert when the first land on an article. Most people will go through the website, read a few articles, forget about it for a few weeks, come back to it and only then convert. That’s why it’s important to also measure first click.
What is First click interaction? First click means that the reader discovered your website through a blog post, but they converted somewhere else, probably a few days or weeks later.
First click gives a better overview of how a reader interacted with your website, and then converted. It means that the reader was influenced at some point by your content, and we can effectively say that your content played a role in converting that user.
As you can see from the above screenshot, the numbers may vary between first and last click. So when we’re calculating how many leads a blog post generated, we’ll take the higher number of the two and use that.
Every month, add up all the numbers and that will tell you how many conversions you got from your blog content. So for the period of the 7th to the 18th of March, Mint Studios got 10 newsletter subscribers. We also have a Data Studio dashboard set up to help us see more numbers, but this is a good place to start.
Step 3: Calculate the number of leads you need to break even
Now that you know how many conversions you’re getting, how do you calculate the number of customers?
Your boss or team manager might not understand much about backlinks, Tag Manager, clicks and events – and that’s normal. That’s why content marketers should learn how to translate everything that’s going on in the website into business terms.
How can you connect it to business terms? How can you then calculate the return on the investment you’re putting into content?
Many marketers will already know how to calculate this, but we’ll still put it here as this is how we do it. To begin with, you need two numbers:
- The annual value of a customer (how much money they generate the business)
- Your lead to close rate
If you don’t know the value of one customer for your company, you can either use a competitor’s, or do it via an allowable CAC (see G&C’s excel to find out how to use that).
If you have the lead to close rate, you calculating the number of customers is relatively straightforward. With a lead to close rate of 30%, 20 leads = 6 customers. If one customer is worth £1,000 over the course of one year, then your content has just generated £6,000 worth in business. Remove the costs of doing content marketing, and ta-da: you have your profit and ROI.
With these two numbers, you can also calculate how many leads you need to get per month in order to break even.
Say each customer generates £12,000 per year in revenue for our business and we have a lead to close rate of 2% (these are real numbers from a B2B fintech company by the way).
Here’s how it looks like in an Excel (created by Grow & Convert — head to their page and copy the Google Sheets to get your own spreadsheet):
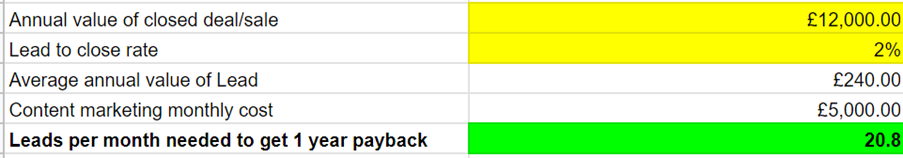
As we can see, with an annual value of £12,000 and a lead to close rate of 2%, we just need 21 leads per month to break even (based on costs of doing work with Mint Studios).
What’s fun is to play around with the numbers and see what works. We use this template when we first start working with a client, so we have a goal to work on. It’s also a good way to see if content marketing makes sense. If the goal is 500 leads to break even and you’re in a very competitive niche, then it might not make sense to invest so many resources into content (although it varies from situation to situation).
This spreadsheet also demonstrates how powerful content marketing is for B2B companies with high ticket customers. The more valuable a lead, the fewer you need to break even from costs. Which is why Bottom of the Funnel content for B2B fintech companies is incredibly valuable.
If you know your lead to customer conversion rate, then you know how many customers you are getting from content marketing. In this case, 21 leads per month will generate just over one customer every three months. For a £12k B2B client, 1 customer per three months is great value.
And the best part? There is no ceiling. Content is an investment, which means that if you continue to implement good content marketing practices, the number of leads you’ll get per month will only increase, more than offsetting your content marketing costs.
This may be obvious for those working in paid marketing and other high attribution marketing activities, but the truth is that most content marketing folk do not track conversions and won’t connect the metrics to business metrics.
The reasoning is that not everything in content marketing can be tracked. What about the brand? What about someone who has blocked tracking on their browser or phone? What about people who sign up elsewhere, or convert over 90 days later?
As we said earlier, this is not a perfect science. There are many other benefits to content marketing, including building trust with your audience, using it for PR and building a brand. We’re not saying that measuring leads will help you track all the rest.
All we’re saying is, if you can measure these conversions — then why not? When it comes to business, quantifying goes a long way, and it’ll be a lot easier to make a case for more investment by putting numbers to it. Your boss is more likely to agree to an investment if you can prove it with numbers. It might suck, but it’s the way our brain and business works.
What if your conversions are low?
Imagine you’ve done all that: you’re tracking your conversions, you can see the results via the Model Comparison Tool and you know how many leads you need to break even on costs. But then you realise: conversions are too low. What do you do?
We covered that in this article: 6 Reasons Your Content is Not Converting (And How to Fix Each One)
Tracking and attributing conversions still isn’t common practice in the content marketing world, but we believe that it’s something that provides valuable information. Even if you aren’t creating content to get a return on investment (e.g. thought leadership), just knowing how people are interacting with your articles is incredible information. So why not?
Want to learn more about how we do content marketing for clients? Click the button below. 👇